
Image: 20210818 Greenhouse gas emissions by income category - UN Emissions Gap Report

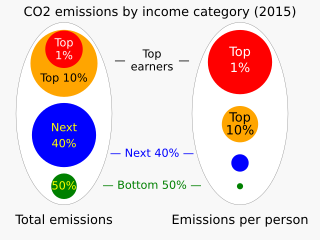
Description: Diagram showing carbon dioxide emissions and per-person carbon dioxide emissions, arranged by income category, based on data from the UN Emissions Gap Report 2020 Source: Fig. ES.8 of Emissions Gap Report 2020 / Executive Summary. UNEP.org XV. United Nations Environment Programme (2021). Archived from the original on 31 July 2021. Archive thereof: https://web.archive.org/web/20210731143517/https://wedocs.unep.org/bitstream/handle/20.500.11822/34438/EGR20ESE.pdf Quotation from source:The emissions of the richest 1 per cent of the global population account for more than twice the combined share of the poorest 50 per cent. Compliance with the 1.5°C goal of the Paris Agreement will require reducing consumption emissions to a per capita lifestyle footprint of around 2–2.5 tCO2e by 2030. This means that the richest 1 per cent would need to reduce their current emissions by at least a factor of 30, while per capita emissions of the poorest 50 per cent could increase by around three times their current levels on average (figure ES.8).Suggested caption:The emissions of the richest 1% of the global population account for more than twice the combined share of the poorest 50%. Compliance with the 1.5°C goal of the Paris Agreement would require the richest 1% to reduce their current emissions by at least a factor of 30, while per-person emissions of the poorest 50% could increase by a factor of about 3. Calculations are based on data from Figure ES.8 from source:Earners category — % of population — % of Emissions — Emissions per person top 1% _ 1 _ 15 _ 15.00 top 10% _ 10 _ 48 _ 4.80 Middle 40% _ 40 _ 44 _ 1.10 Bottom 50% _ 50 _ 7 _ 0.14 Square roots of right two columns (for calculating radius of circles):
% of Emissions — Emissions per person 3.873 _ 3.873 6.928 _ 2.191 6.633 _ 1.049 2.646 _ 0.374Normalized so smallest value = 1.00. These are the values literally used in the SVG code for circles' radii.
% of Emissions — Emissions per person 1.464 _ 10.351 2.619 _ 5.855 2.507 _ 2.803 1.000 _ 1.000
Author: RCraig09
Usage Terms: Creative Commons Attribution-Share Alike 3.0
License: CC-BY-SA-3.0
License Link: http://creativecommons.org/licenses/by-sa/3.0/
Attribution Required?: Yes
Image usage
The following page links to this image:
