
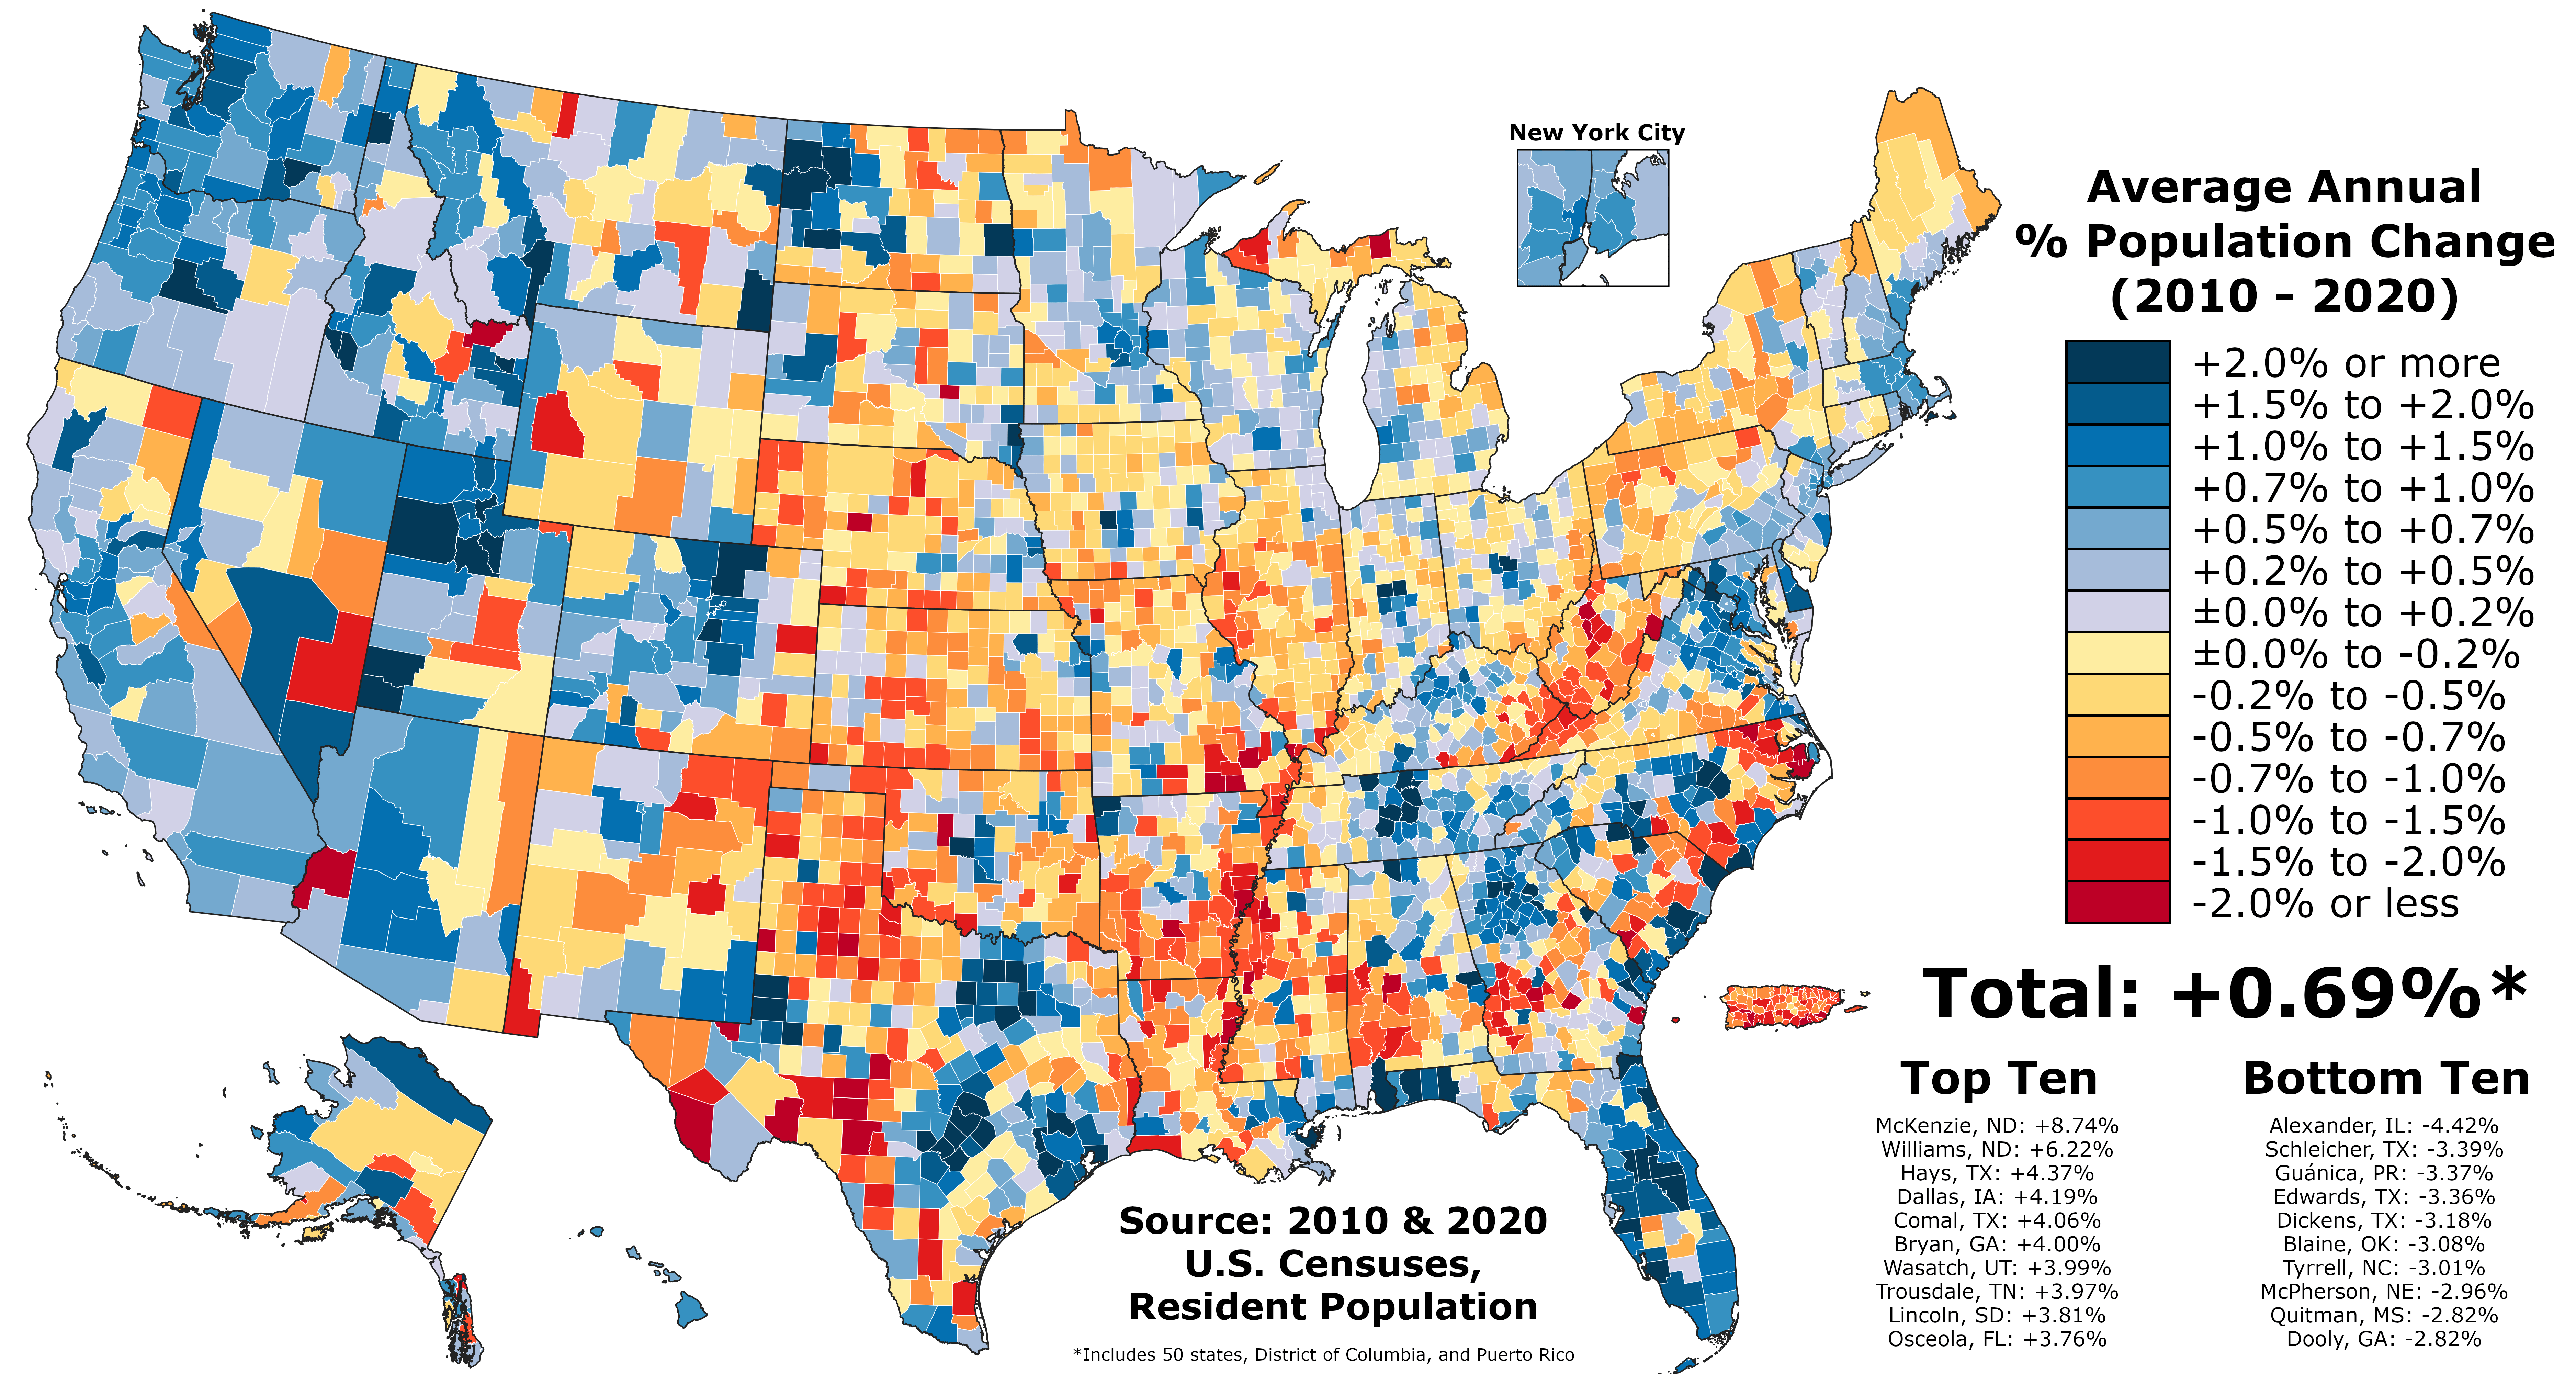
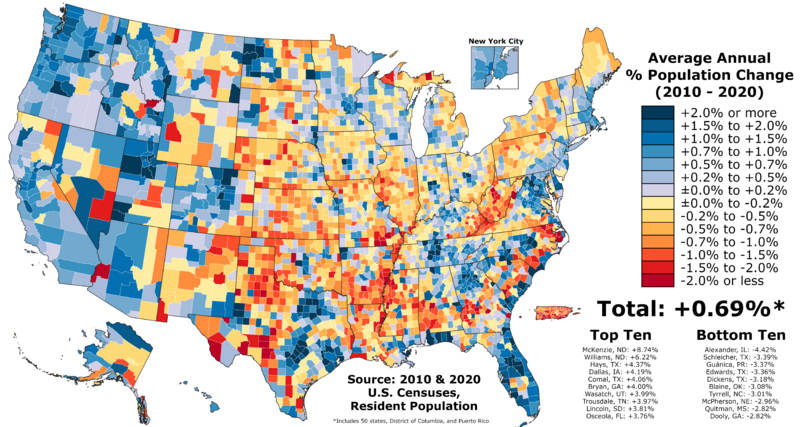
Image: Annual population growth in the U.S. by county - 2010s
Size of this preview: 800 × 427 pixels. Other resolutions: 320 × 171 pixels | 7,500 × 4,000 pixels.
Original image (7,500 × 4,000 pixels, file size: 1.87 MB, MIME type: image/png)
Description: The map above shows the average annual resident population growth rate of each county in the fifty states, D.C., and Puerto Rico between the 2010 United States Census and the 2020 United States Census. Results can be found here and here.
Title: Annual population growth in the U.S. by county - 2010s
Credit: Own work
Author: Abbasi786786
Usage Terms: Creative Commons Attribution-Share Alike 4.0
License: CC BY-SA 4.0
License Link: https://creativecommons.org/licenses/by-sa/4.0
Attribution Required?: Yes
Image usage
The following 2 pages link to this image:

All content from Kiddle encyclopedia articles (including the article images and facts) can be freely used under Attribution-ShareAlike license, unless stated otherwise.