
Image: Annual population growth rate by U.S. state

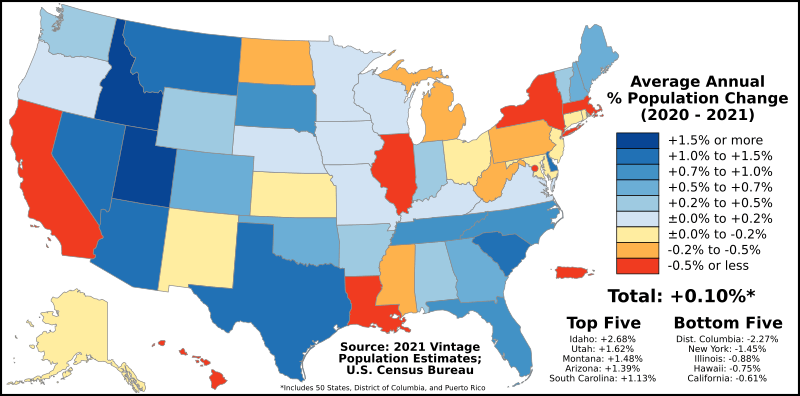
Description: The map above shows the average annual resident population growth rate of each U.S. state, the District of Columbia, and Puerto Rico according to the latest official estimates, which is currently the 2021 Vintage Population Estimates. Results can be found here. The timeframe used for this map will always be between the most recent official population estimates and the most recent official U.S. Census results (or in the case that the most recent official population estimates date to a census year, then the census before that one). So currently, the timeframe for this map goes from the 2020 United States Census resident populations to the 2021 Vintage Population Estimates.
This file should next be updated when the 2022 Vintage Population Estimates are released on the statewide level, currently expected to occur in December 2022. The timeframe of this map will then be switched from "2020 - 2021" to "2020 - 2022".
Average Annual Growth Rates are used instead of the total percentage growth rate since the last census for consistency and to prevent a new legend from being used every single year.
Legend
+1.5% or more
+1.0% to +1.5%
+0.7% to +1.0%
+0.5% to +0.7%
+0.2% to +0.5%
±0.0% to +0.2%
±0.0% to -0.2%
-0.2% to -0.5%
-0.5% or less
Author: Abbasi786786
Usage Terms: Creative Commons Attribution-Share Alike 3.0
License: CC-BY-SA-3.0
License Link: http://creativecommons.org/licenses/by-sa/3.0/
Attribution Required?: Yes
Image usage
The following page links to this image:
