
Image: Asian Americans by state

Size of this PNG preview of this SVG file: 800 × 396 pixels. Other resolution: 320 × 158 pixels.
Original image (SVG file, nominally 1,199 × 593 pixels, file size: 90 KB)
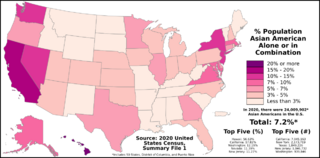
Description: The map above shows the proportion of Asian Americans (alone or in combination) in each U.S. state, the District of Columbia, and Puerto Rico according to the official results of the 2020 United States Census. The data can be found here. This file should next be updated when the 2021 Vintage Racial and Ethnic Population Estimates are released on the statewide level, currently expected to occur in June 2022.
Legend 20% or more 15% - 20% 10% - 15% 7% - 10% 5% - 7% 3% - 5% Less than 3%
Author: Abbasi786786
Usage Terms: Creative Commons Attribution-Share Alike 3.0
License: CC-BY-SA-3.0
License Link: http://creativecommons.org/licenses/by-sa/3.0/
Attribution Required?: Yes
Image usage
The following page links to this image:

All content from Kiddle encyclopedia articles (including the article images and facts) can be freely used under Attribution-ShareAlike license, unless stated otherwise.