
Image: Aviation GHG emissions in the EU ETS and the top 10 emitters in aviation 2013-2019-en

Size of this PNG preview of this SVG file: 638 × 414 pixels. Other resolution: 320 × 208 pixels.
Original image (SVG file, nominally 638 × 414 pixels, file size: 28 KB)
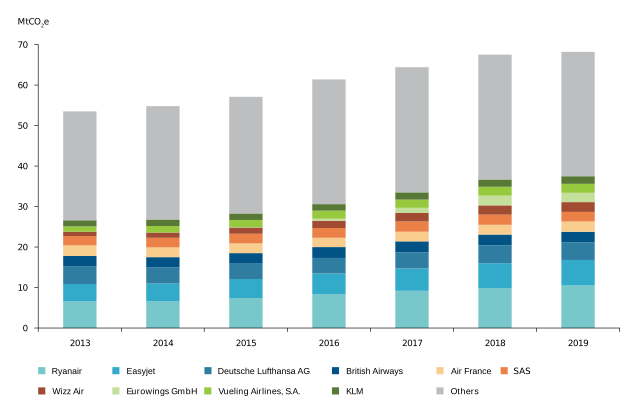
Description: Aviation GHG emissions in the EU ETS and the top 10 emitters in aviation (2013-2019). Note:For the period 2013-2019, only flights within the European Economic Area were under the EU ETS. Flights between the continental European Economic Area and its outermost regions were also exempt.
Title: Aviation GHG emissions in the EU ETS and the top 10 emitters in aviation 2013-2019-en
Credit: Figure 3.4 from EEA Report No 19/2020 https://www.eea.europa.eu/ds_resolveuid/1d491124b59a4f5099b5d13ac707eee9
Author: European Environmental Agency (extraction and SVG conversion by EconAmbiente)
License: Attribution
Image usage
The following page links to this image:

All content from Kiddle encyclopedia articles (including the article images and facts) can be freely used under Attribution-ShareAlike license, unless stated otherwise.