
Image: Boiling point vs molar mass graph
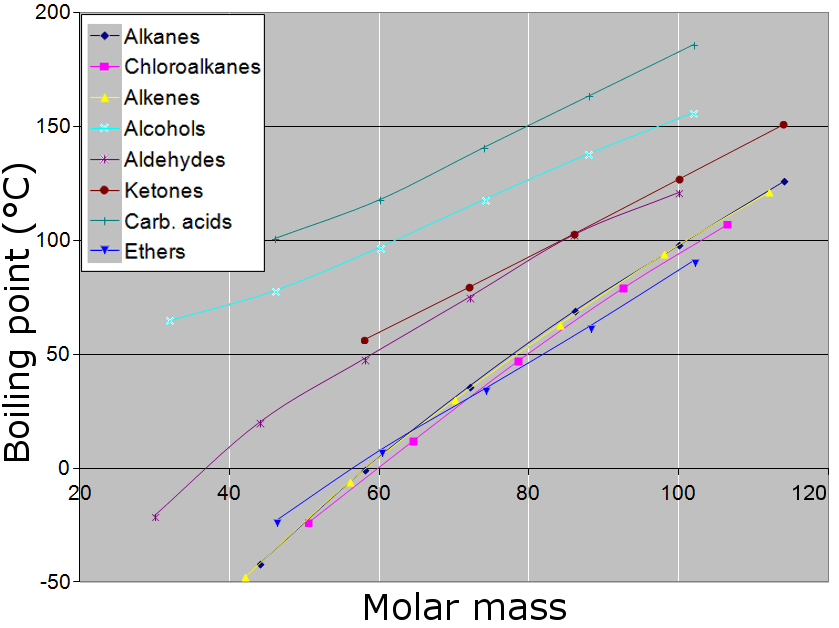
Description: Graph showing the boiling points of alkanes, alkenes, ethers, halogenoalkanes, aldehydes, ketones, alcohols and carboxylic acids as a function of molar mass. In all cases, boiling points of straight-chain compounds are used. All the curves show approximately the same gradient. Grouping of the curves shows the difference in strength between induced dipole-induced dipole forces (alkanes, alkenes, ethers and halogenoalkanes), permanent dipole-permanent dipole forces which raise the boiling points of aldehydes and ketones, and finally the strongest intermolecular hydrogen bonding in alcohols and carboxylic acids. Carboxylic acids have higher boiling points than alcohols due to the further presence of the polar C=O bond.
Title: Boiling point vs molar mass graph
Credit: Own work
Author: Jpta
Usage Terms: Creative Commons Attribution-Share Alike 3.0
License: CC BY-SA 3.0
License Link: http://creativecommons.org/licenses/by-sa/3.0
Attribution Required?: Yes
Image usage
There are no pages that link to this image.
