
Image: CS diagram

Size of this PNG preview of this SVG file: 438 × 180 pixels. Other resolution: 320 × 132 pixels.
Original image (SVG file, nominally 438 × 180 pixels, file size: 202 KB)
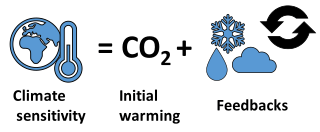
Description: Diagram of factors that determine climate sensitivity. After increasing CO2 levels (or any other type of forcing), the climate system immediately starts warming. This warming gets amplified by the net effect of feedbacks. Self-reinforcing feedbacks include water vapour, ice-albedo and clouds. The stabilizing feedback of the lapse rate is smaller than the self-reinforcing feedbacks.
Title: CS diagram
Credit: Own work
Author: Femkemilene
Usage Terms: Creative Commons Attribution-Share Alike 4.0
License: CC BY-SA 4.0
License Link: https://creativecommons.org/licenses/by-sa/4.0
Attribution Required?: Yes
Image usage
The following page links to this image:

All content from Kiddle encyclopedia articles (including the article images and facts) can be freely used under Attribution-ShareAlike license, unless stated otherwise.