
Image: Carbon Dioxide 800kyr
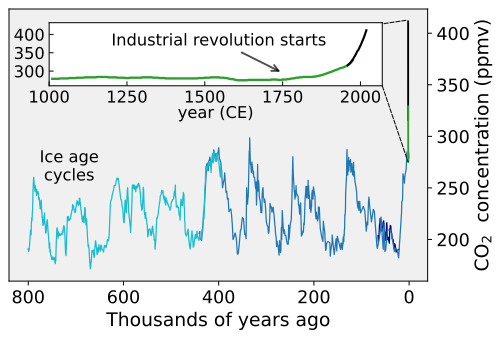
Description: This figure shows the variations in concentration of carbon dioxide (CO2) in the atmosphere during the last 800 thousand years. Throughout most of the record, the largest changes can be related to glacial/interglacial cycles within the current ice age. Although the glacial cycles are thought to be directly caused by changes in the Earth's orbit (i.e. Milankovitch cycles), these changes also influence the carbon cycle, which in turn feeds back into the glacial system. Since the Industrial Revolution, circa 1800, the burning of fossil fuels has caused a rapid increase of CO2 in the atmosphere, reaching levels unprecedented in the last million years. This increase has been implicated as a primary cause of global warming. The spacing of carbon dioxide samples varies through time. At the present, the atmosphere is sampled routinely and complete annual averages are available. From the four ice cores presented on this plot the sampling varies from as rapid as one point every few years (recent parts of the Law Dome record) to as sparse as one sample every few thousand years (oldest parts of the Vostok and Dome C records). In principle, the sparse sampling in the oldest parts of the record could hide abrupt excursions; however, isotopic measurements of ice cores (which are made continuously along the entire core) and our current understanding of the rates of natural processes for creating and removing carbon dioxide from the atmosphere make it unlikely that any positive excursions in carbon dioxide comparable to the Industrial Revolution have happened during the interval presented above. This figure is an update on File:Carbon Dioxide 400kyr.png, originally made by User: Dragons flight originally made by Dragons flight. The explanation of the figure is also derived from that work. Two new data sets are added: the CO2 measurements from 2004 to 2019 and additional data from Dome C. Some other data sets were omitted for simplicity. The code to produce this figure is freely available on Github: https://github.com/Femkemilene/Global-Warming-Figures. The first few lines of the code make it easy to change the language.
Title: Carbon Dioxide 800kyr
Credit: Own work
Author: Femke Nijsse
Usage Terms: Creative Commons Attribution-Share Alike 3.0
License: CC BY-SA 3.0
License Link: https://creativecommons.org/licenses/by-sa/3.0
Attribution Required?: Yes
Image usage
The following page links to this image:
