
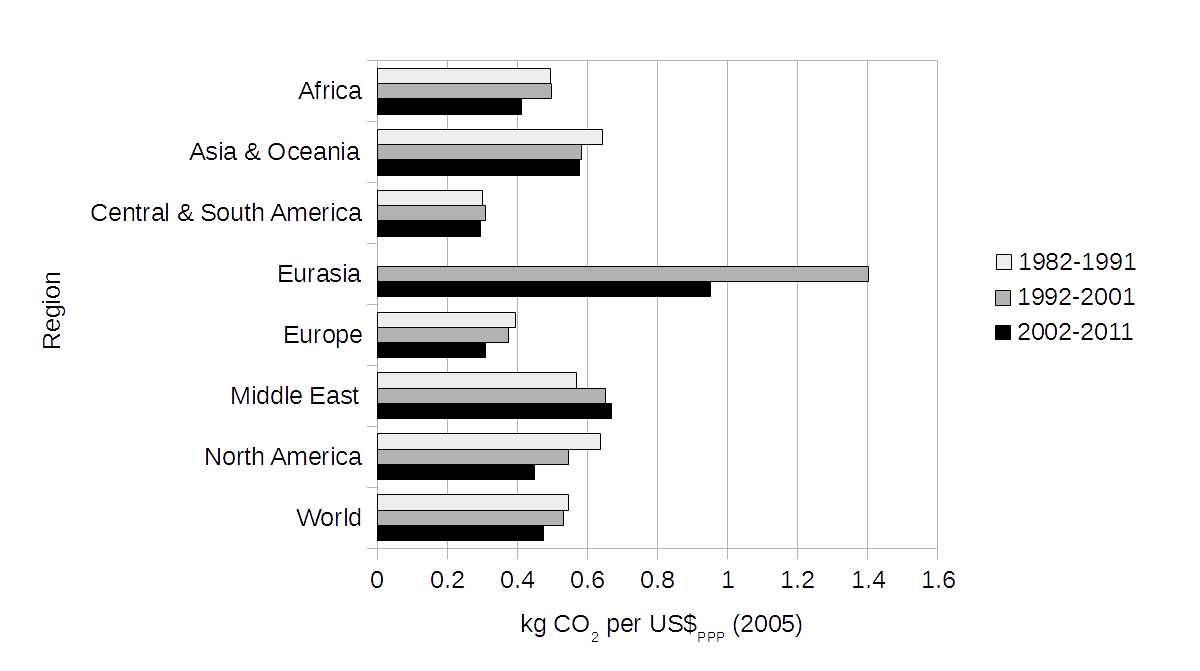
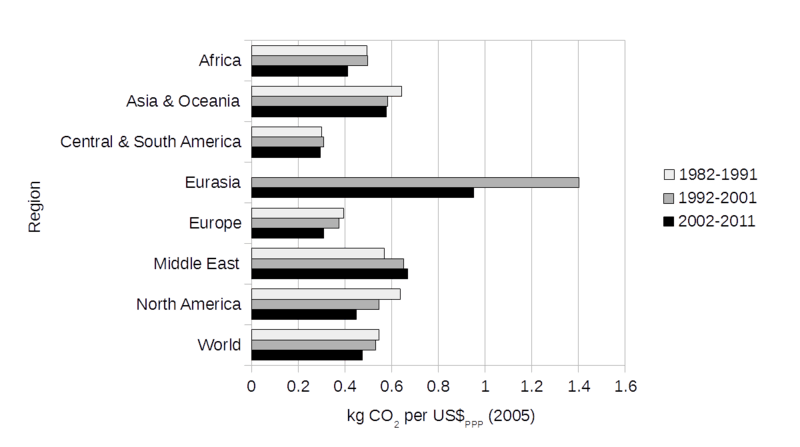
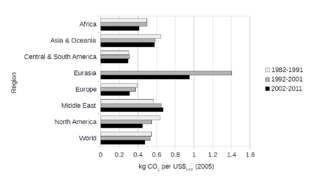
Image: Carbon intensity of GDP (using PPP) for different regions, 1982-2011
Description: This bar graph shows the carbon intensity of gross domestic product (GDP) for different regions between the years 1982 and 2011. Carbon intensity of GDP is defined as annual carbon dioxide emissions divided by annual GDP. Carbon dioxide emissions are measured in kilograms. GDP is measured in US dollars (year 2005 values) using purchasing power parities (PPP). The regions are: Africa, Asia and Oceania, Central and South America, Eurasia, Europe, the Middle East, North America, and the world. These regional groupings are defined in a later section. Three carbon intensity values are given for each region, which are averaged over the years 1982 to 1991, 1992 to 2001, and 2002 to 2011. Data are given in a later section. Intensities show variations regionally and over time. Global carbon intensity has, on average, fallen over this time period. References Data are from a public-domain source: US Energy Information Administration ((Please provide a date)) International Energy Statistics: Carbon Intensity using Purchasing Power Parities (Metric Tons of Carbon Dioxide per Thousand Year 2005 U.S. Dollars)[1]. Archived 11 October 2014.
Title: Carbon intensity of GDP (using PPP) for different regions, 1982-2011
Credit: Own work
Author: Enescot
Usage Terms: Creative Commons Zero, Public Domain Dedication
License: CC0
License Link: http://creativecommons.org/publicdomain/zero/1.0/deed.en
Attribution Required?: No
Image usage
There are no pages that link to this image.

_for_different_regions,_1982-2011.png)