Image: Cash-for-clunckers-chart

Size of this preview: 701 × 600 pixels. Other resolutions: 281 × 240 pixels | 727 × 622 pixels.
Original image (727 × 622 pixels, file size: 16 KB, MIME type: image/png)
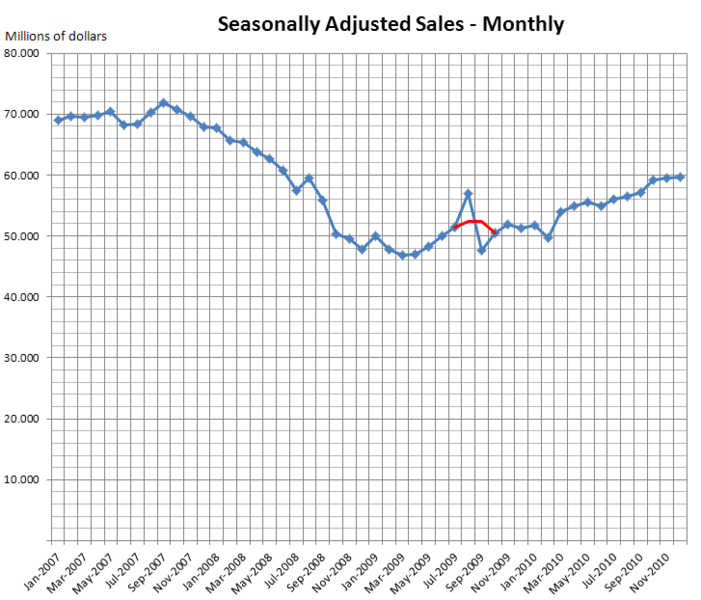
Description: The red line simply averages the sales for the month of the clunkers program (August) and the month after. Spreadsheet: http://www.mediafire.com/view/?92qw8tyqg5fnvp6 Source: US Census Retail Trade Report, https://www.census.gov/retail/#mrts Category 4411 and 4412
Title: Cash-for-clunckers-chart
Credit: Own work
Author: Neo139
Usage Terms: Creative Commons Zero, Public Domain Dedication
License: CC0
License Link: http://creativecommons.org/publicdomain/zero/1.0/deed.en
Attribution Required?: No
Image usage
The following page links to this image:

All content from Kiddle encyclopedia articles (including the article images and facts) can be freely used under Attribution-ShareAlike license, unless stated otherwise.
