
Image: Change in Average Temperature With Fahrenheit

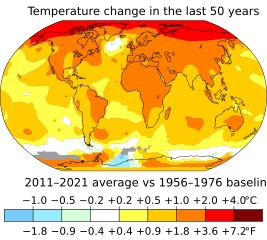
Description: Surface air temperature changes to date have been most pronounced in northern latitudes and over land masses. The image uses longer term averages of at least a decade to smooth out climate variability due to factors such as El Niño. The map is improved from the highest quality rendering that NASA’s Scientific Visualization Studio generates, with horizontal and vertical lines removed and with a more legible projection of Kavraiskiy VII. Grey areas in the image have insufficient data for rendering. For a version without Fahrenheit, see File:Change in Average Temperature.svg
Author: NASA’s Scientific Visualization Studio, Key and Title by uploader (Eric Fisk)
Usage Terms: Creative Commons Attribution-Share Alike 3.0
License: CC-BY-SA-3.0
License Link: http://creativecommons.org/licenses/by-sa/3.0/
Attribution Required?: Yes
Image usage
The following page links to this image:
