
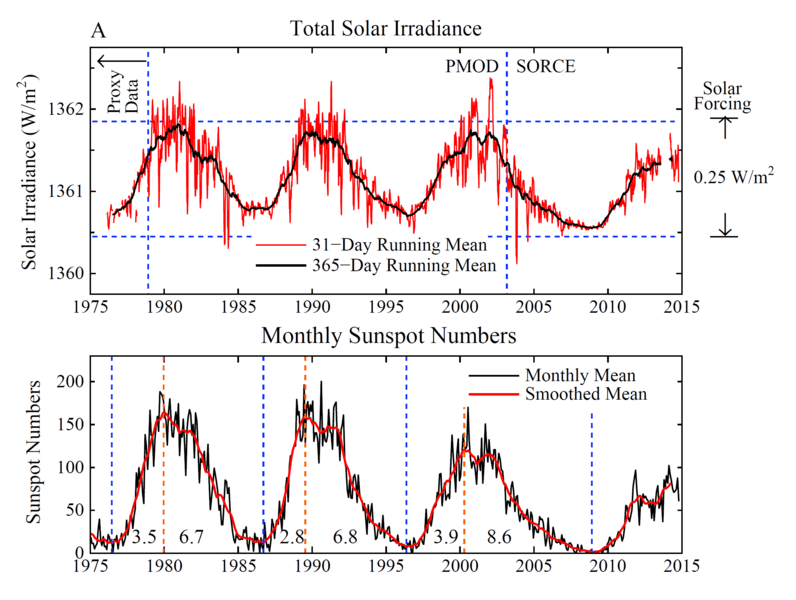
Image: Changes in total solar irradiance and monthly sunspot numbers, 1975-2013

Description: These two graphs show changes in total solar irradiance (TSI, labelled "A") and monthly sunspot numbers ("B") between approximately 1975 to 2013. TSI is measured in watts per square metre (W.m-2), with 31-day and 365-day running means plotted. The 31-day mean shows more variability than the 365-day mean. Both curves show a pattern of peaks and troughs (see: solar cycle). The range of changes in solar forcing (365-day mean) over the time period is 0.25 W.m2. Graph B plots a monthly mean and smoothed mean, with the monthly mean showing more variability than the smoothed mean. The pattern of peaks and troughs in total solar irradiance is replicated in this graph of monthly sunspot numbers. A summary of the data is given in a later section.
Title: Changes in total solar irradiance and monthly sunspot numbers, 1975-2013
Credit: Open access: Figure 7, in: Hansen, J., et al. (2013). Assessing “Dangerous Climate Change”: Required Reduction of Carbon Emissions to Protect Young People, Future Generations and Nature.. Archived 14 August 2014. A high-resolution version of this image is available here (archived 16 July 2014).
Author: Hansen J, Kharecha P, Sato M, Masson-Delmotte V, Ackerman F, et al.
Usage Terms: Creative Commons Zero, Public Domain Dedication
License: CC0
License Link: http://creativecommons.org/publicdomain/zero/1.0/deed.en
Attribution Required?: No
Image usage
There are no pages that link to this image.
