
Image: Climate change mitigation scenarios (IIASA). Atmospheric greenhouse gas concentrations 2000-2100

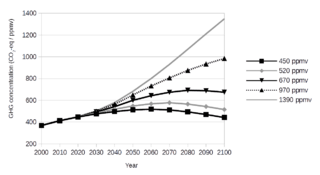
Description: This graph shows projected changes in atmospheric greenhouse gas (GHG) concentrations between the years 2000 and 2100 for a range of climate change mitigation scenarios. GHG concentrations are measured in carbon dioxide-equivalents (GtCO2-eq) in units of parts-per-million by volume (ppmv). Concentrations include the full basket of GHGs as well as other radiatively active gases, such as aerosol and aerosol precursors. Projections for 5 scenarios are shown. Each scenario is designed to stabilize atmospheric GHG concentrations at a different level: 450, 520, 670, 970 and 1390 ppmv. A summary table of the graph data is given in a later section. References Scenario data can be freely downloaded from: International Institute for Applied System Analysis (IIASA) GGI Scenario Database Ver 2.0, 2009. Archived 4 October 2013. These are the "A2r" mitigation scenarios.
Title: Climate change mitigation scenarios (IIASA). Atmospheric greenhouse gas concentrations 2000-2100
Credit: Own work
Author: Enescot
Usage Terms: Creative Commons Zero, Public Domain Dedication
License: CC0
License Link: http://creativecommons.org/publicdomain/zero/1.0/deed.en
Attribution Required?: No
Image usage
The following page links to this image:

._Atmospheric_greenhouse_gas_concentrations_2000-2100.png)