
Image: Co2-temperature-records
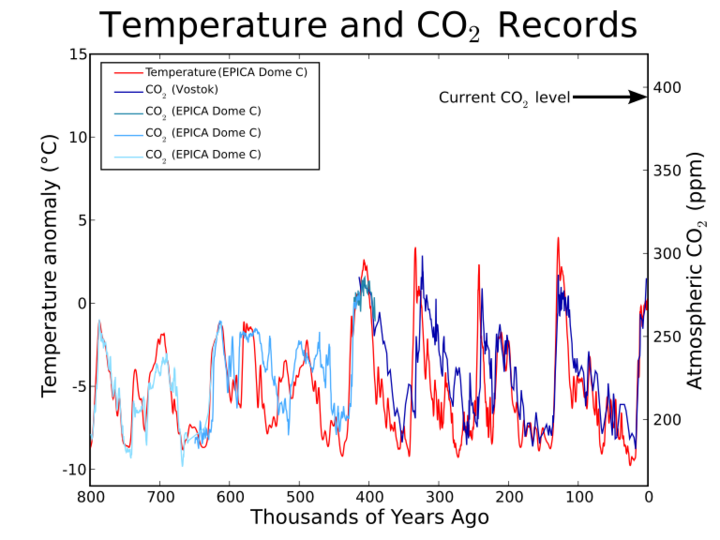
Description: This figure shows historical carbon dioxide (right axis) and reconstructed temperature (as a difference from the mean temperature for the last 100 years) records based on Antarctic ice cores, providing data for the last 800,000 years. This figure was produced by Leland McInnes using python and matplotlib and is licensed under the GFDL. All data is from publicly available sources.
(red) EPICA Dome C temperature data: (dark blue) Vostok CO2 data: (steel blue) EPICA DomeC temperature data, 423-391 kybp: (pale blue) EPICA DomeC CO2 data, 650-413 kybp: (cyan) EPICA DomeC CO2 data, 800-650 kybp: Current CO2 level: Carbon dioxide#Concentrations of CO2 in atmosphere
Author: Leland McInnes (talk) (Uploads)
Usage Terms: Creative Commons Attribution-Share Alike 3.0
License: CC-BY-SA-3.0
License Link: http://creativecommons.org/licenses/by-sa/3.0/
Attribution Required?: Yes
Image usage
The following page links to this image:
