
Image: CompressorDischargeTemperatureVSAmbient
Size of this preview: 686 × 600 pixels. Other resolutions: 275 × 240 pixels | 1,317 × 1,151 pixels.
Original image (1,317 × 1,151 pixels, file size: 240 KB, MIME type: image/jpeg)
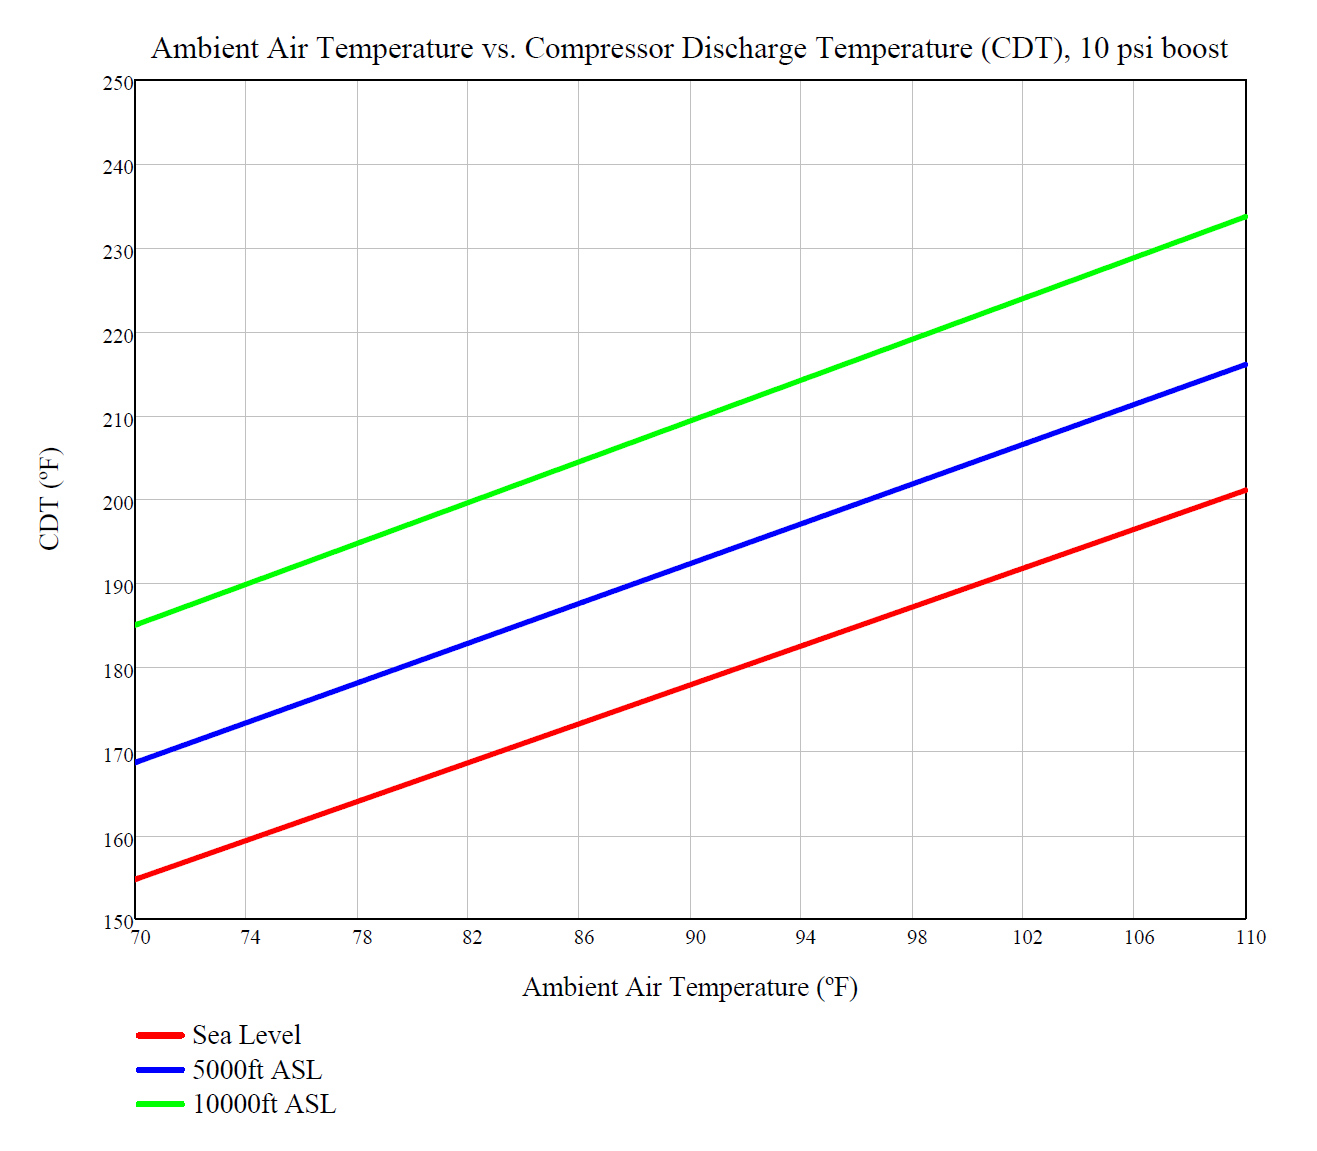
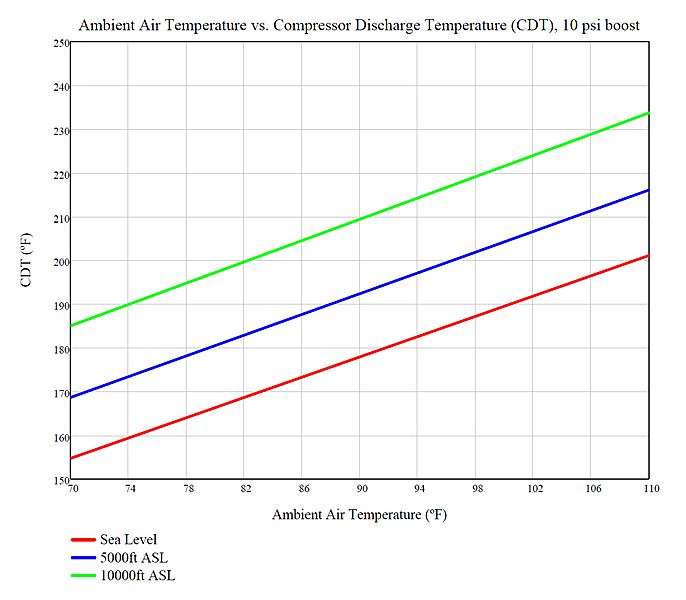
Description: This is a graph showing the compressor discharge temperature vs. ambient temperature for 10 psi of boost. The red line is at sea level (14.696 psia), the blue dotted line is at 5000 ft above sea level (12.23 psia), and the green dashed line is at 10,000ft above sea level (10.11 psia). Notice that as elevation increases, the CDT increases noticeably for the same ambient temperature.
Title: CompressorDischargeTemperatureVSAmbient
Credit: Own work
Author: OptoMechEngineer
Usage Terms: Creative Commons Attribution-Share Alike 3.0
License: CC BY-SA 3.0
License Link: https://creativecommons.org/licenses/by-sa/3.0
Attribution Required?: Yes
Image usage
The following page links to this image:

All content from Kiddle encyclopedia articles (including the article images and facts) can be freely used under Attribution-ShareAlike license, unless stated otherwise.