
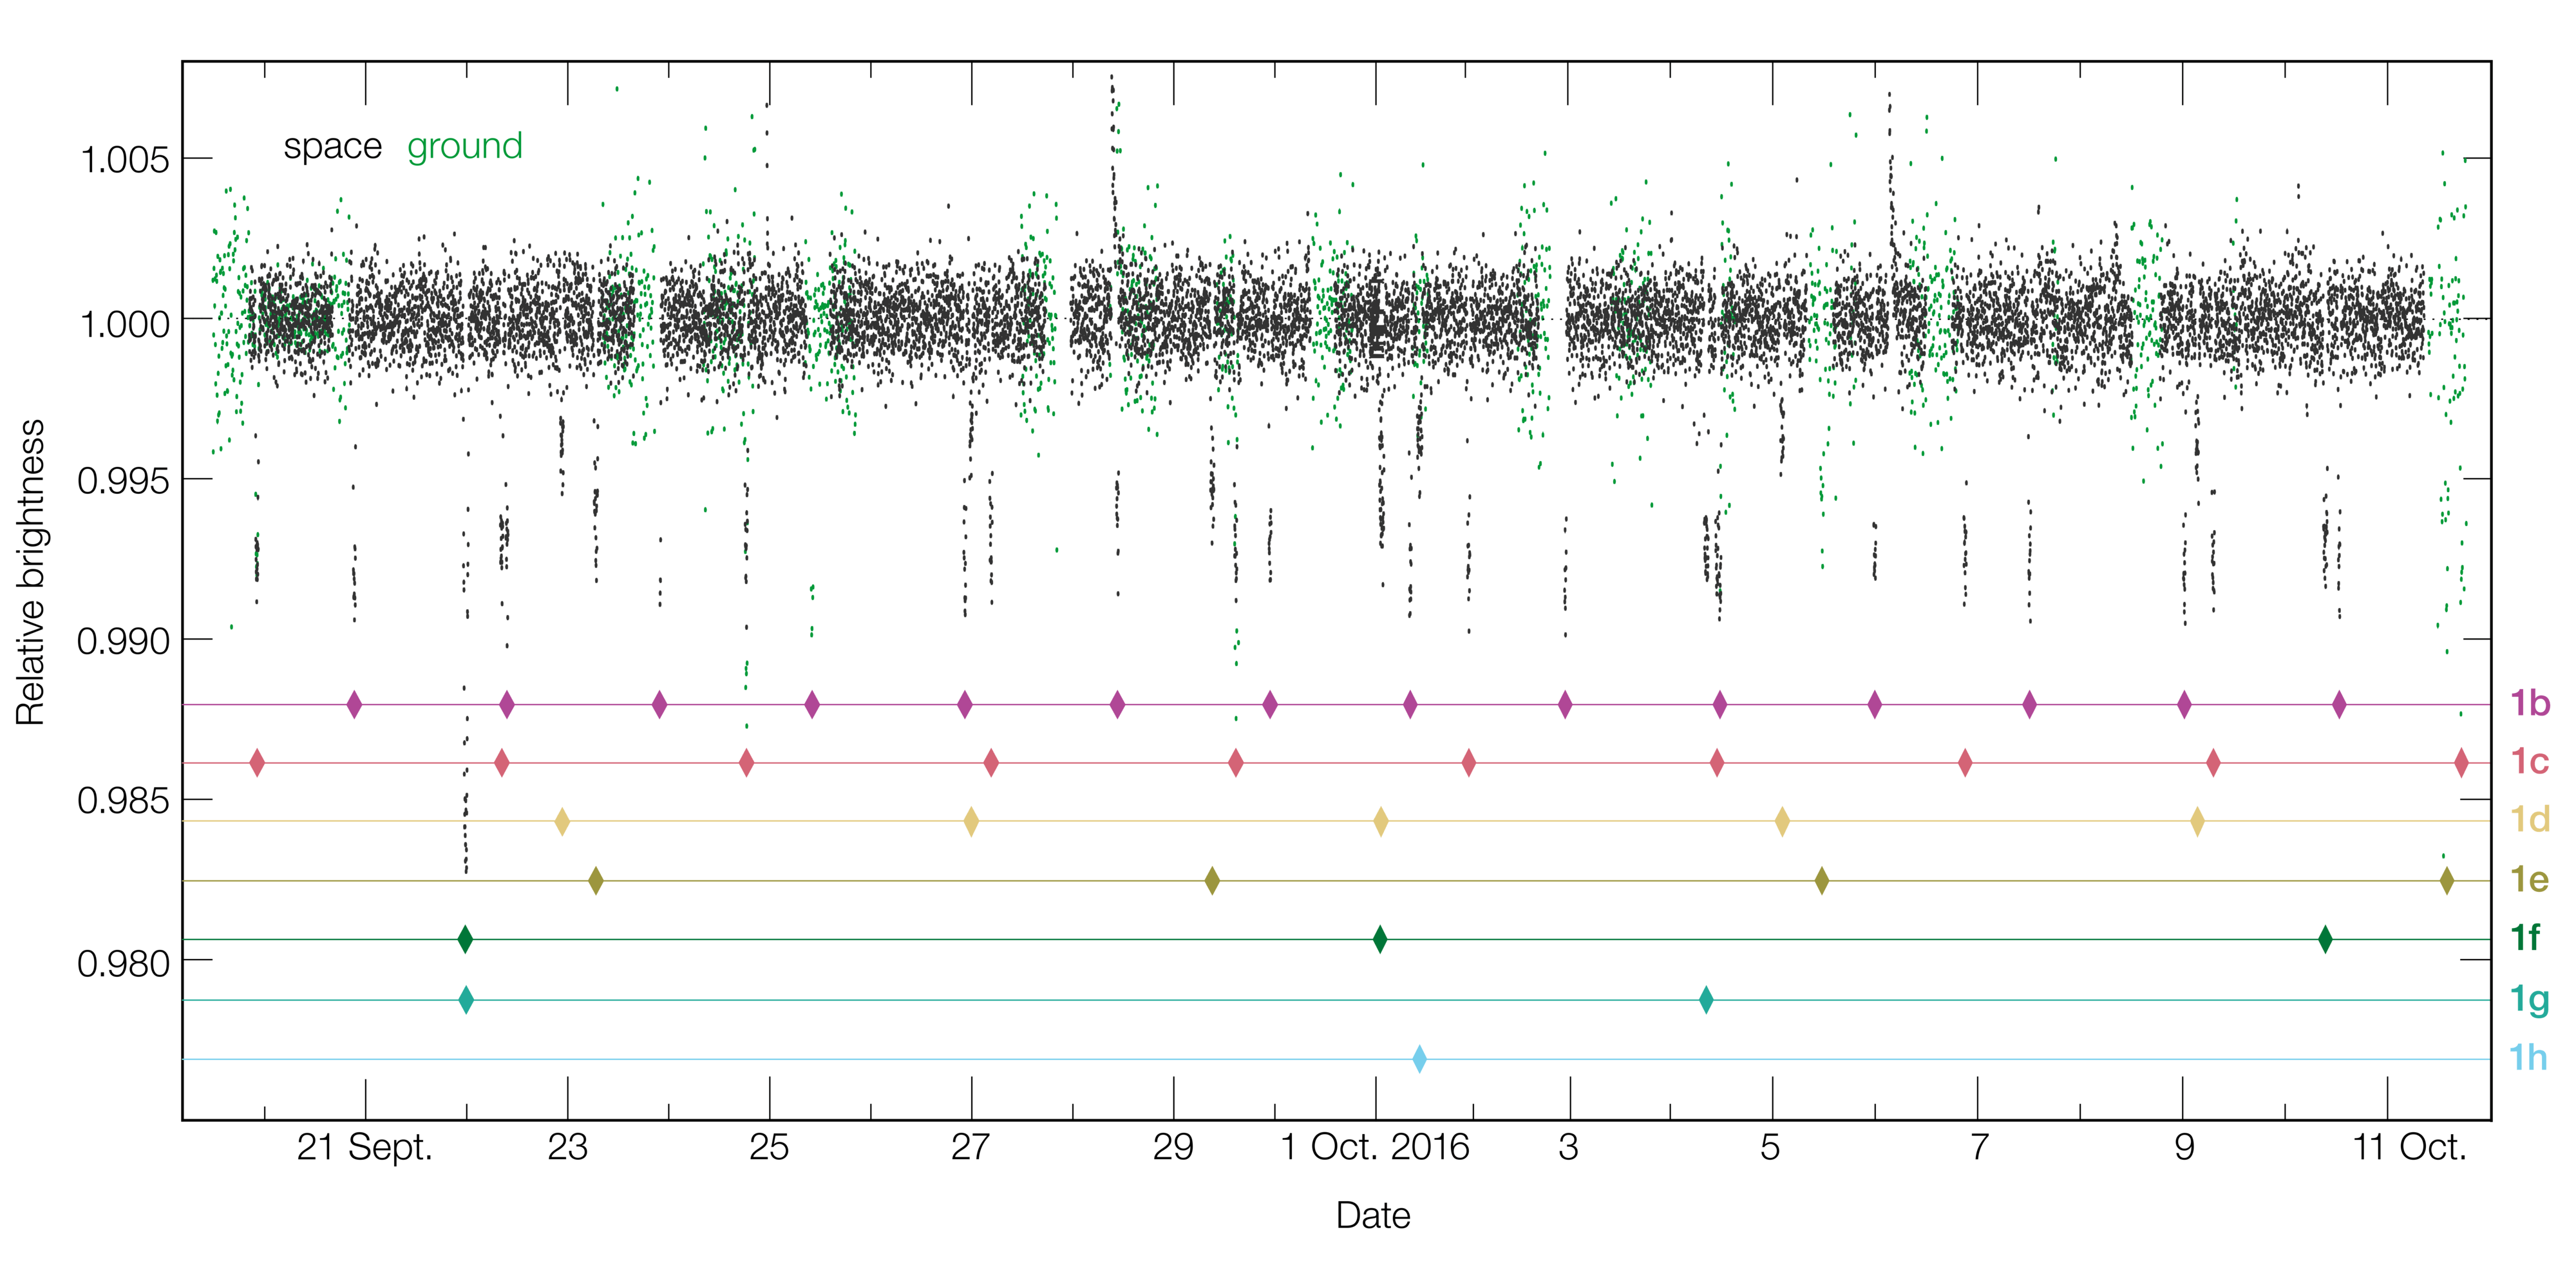
Image: Curva de luz de TRAPPIST-1 que muestra los eventos de disminución de la luz causados por el tránsito de los planetas
Description: This diagram shows the changing brightness of the ultra cool dwarf star TRAPPIST-1 over a period of 20 days in September and October 2016 as measured by NASA’s Spitzer Space Telescope and many other telescopes on the ground. On many occasions the brightness of the star drops for a short period and then returns to normal. These events, called transits, are due to one or more of the star’s seven planets passing in front of the star and blocking some of its light. The lower part of the diagram shows which of the system’s planets are responsible for the transits.
Title: Curva de luz de TRAPPIST-1 que muestra los eventos de disminución de la luz causados por el tránsito de los planetas
Credit: http://www.eso.org/public/chile/images/eso1706e/ (TIFF)
Author: ESO/M. Gillon et al.
Usage Terms: Creative Commons Attribution 4.0
License: CC BY 4.0
License Link: https://creativecommons.org/licenses/by/4.0
Attribution Required?: Yes
Image usage
The following page links to this image:
