
Image: Distribution of committed CO2 emissions from developed fossil fuel reserves
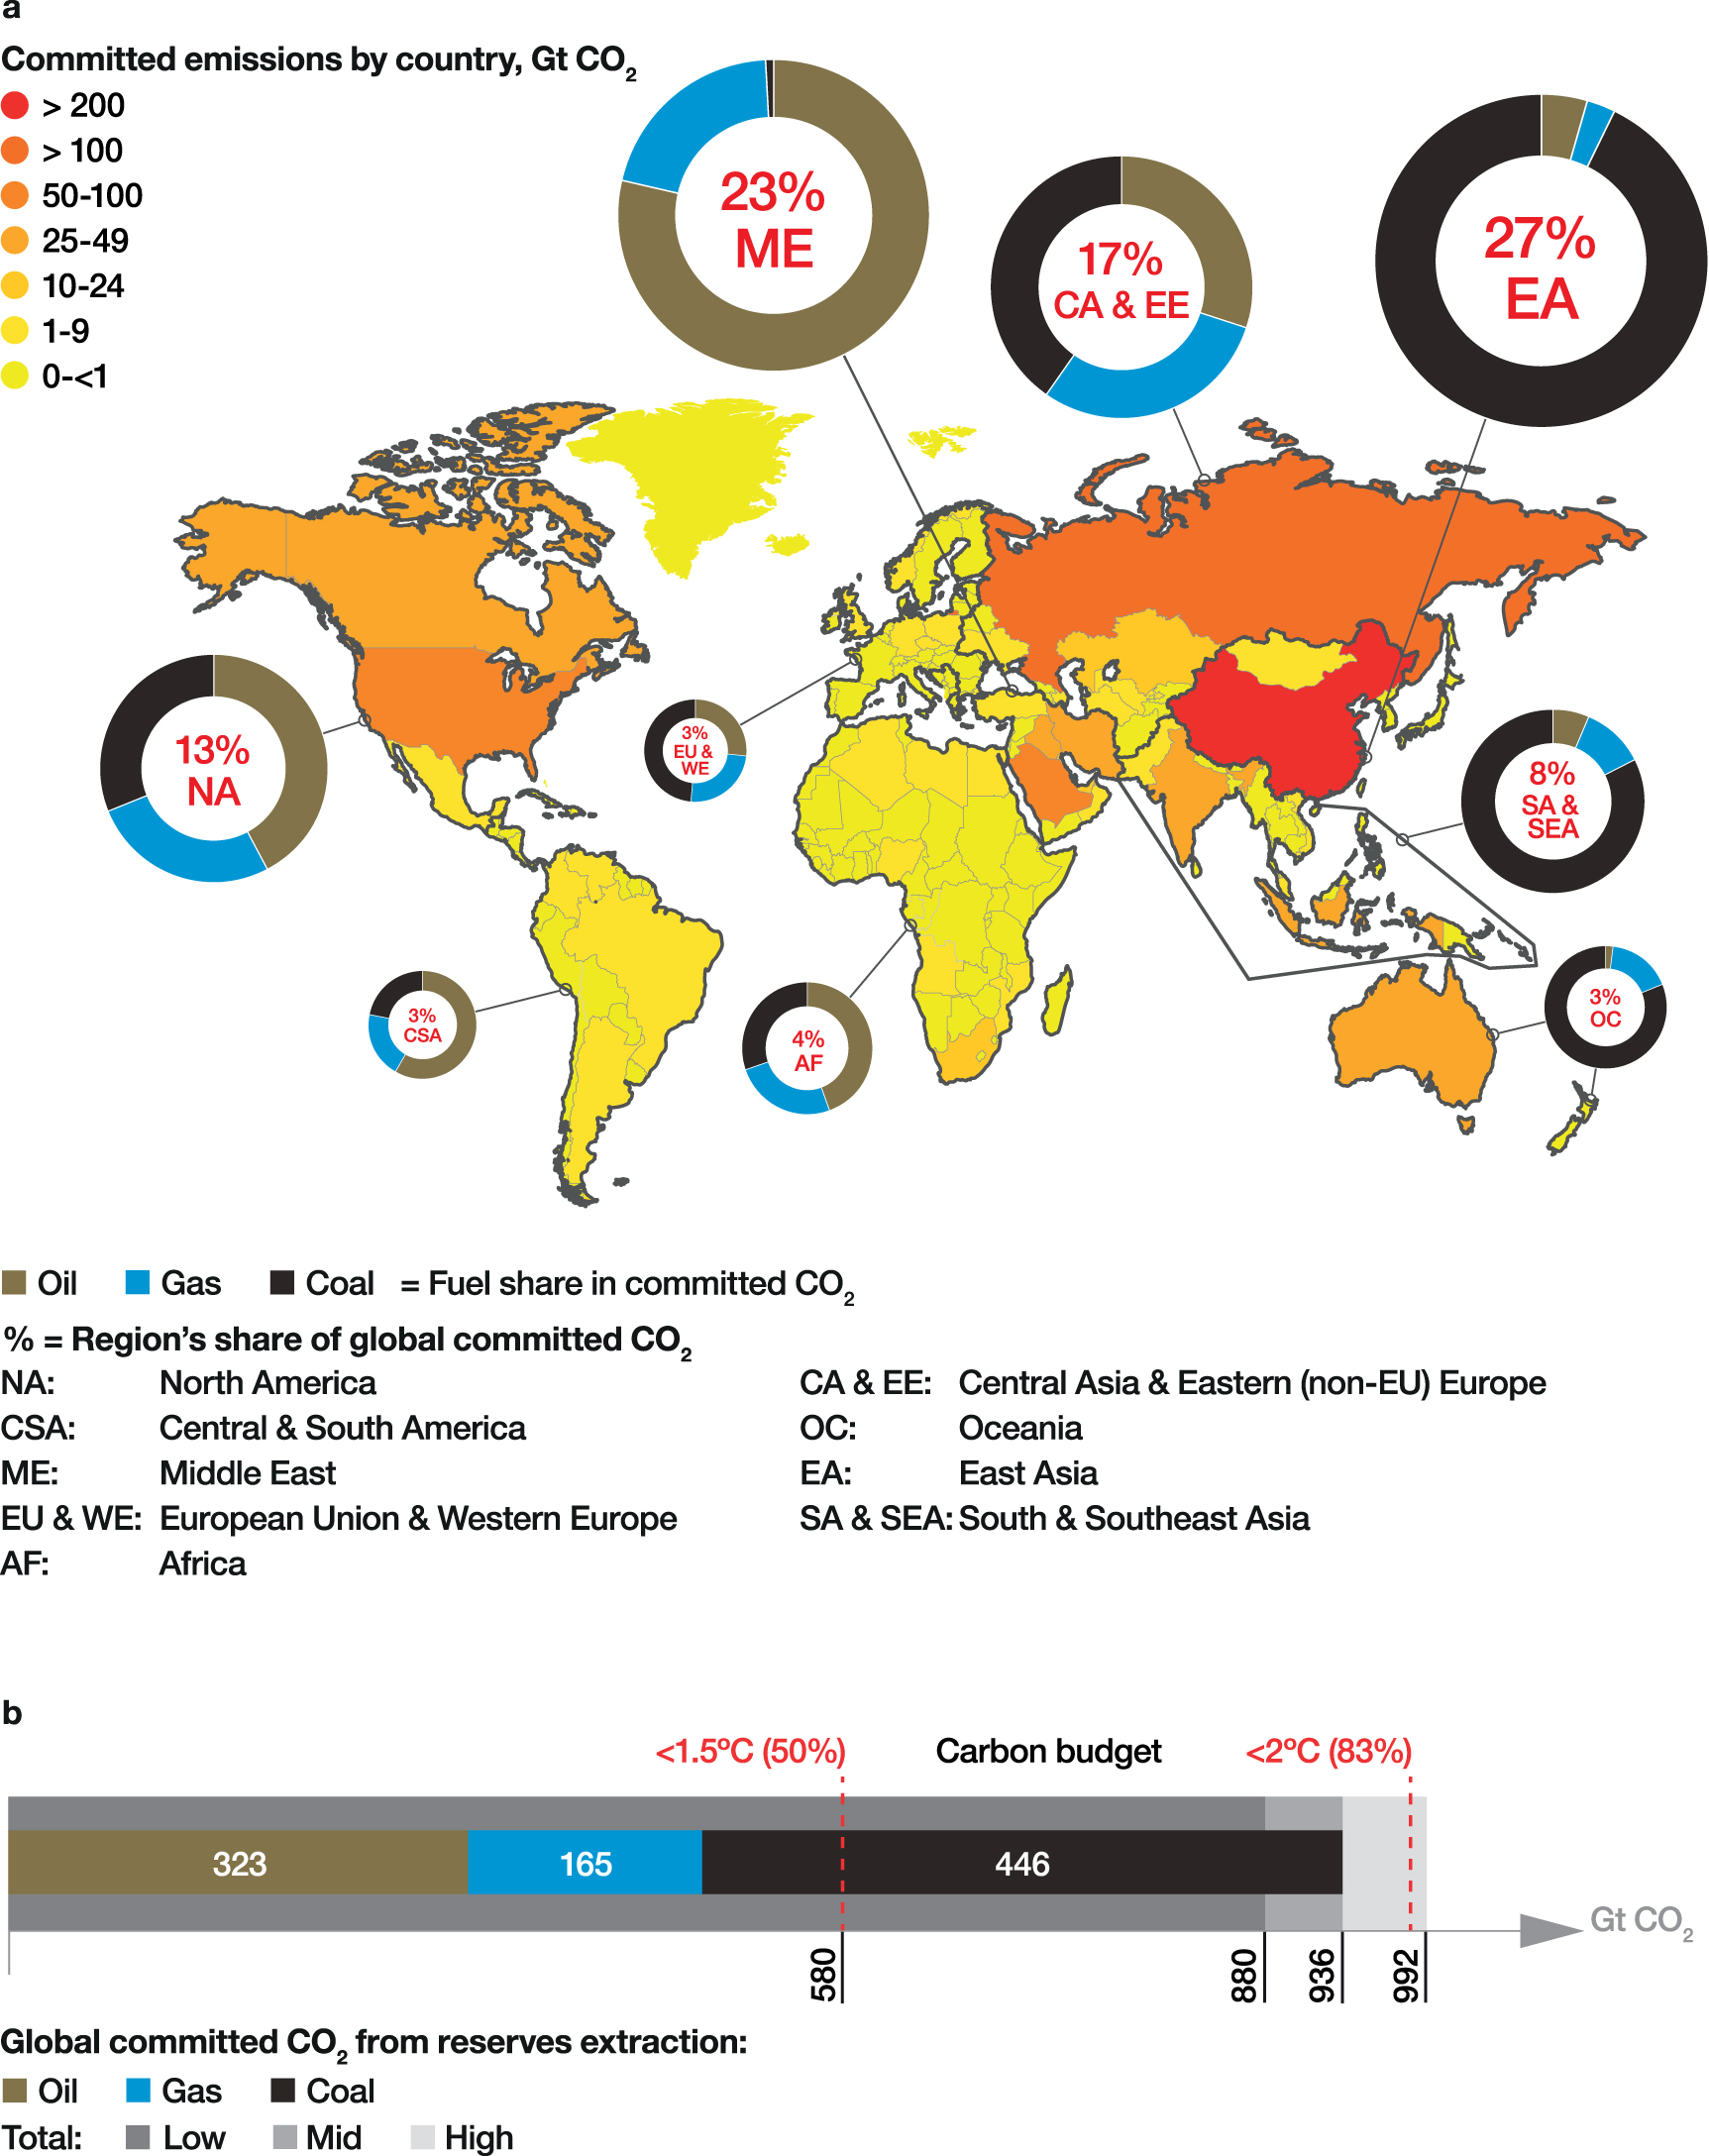
Description: "Distribution of committed CO2 emissions from developed fossil fuel reserves. (a) The map indicates shares of global committed CO2 emissions from extraction by region and by country. The % within each circle is the region's share of global committed CO2. Donut charts show the proportion of oil, gas and coal within the region's total committed CO2. The colour of each country corresponds to its concentration of committed CO2, as displayed in the legend. (b) Our estimate of total global committed CO2 by fuel compared to remaining 1.5 °C and 2 °C carbon budgets for given probabilities as of the start of 2018. The low-to-high uncertainty range displayed is the 90% confidence interval. Regions are defined in table S6."
Author: Authors of the study: Kelly Trout, Greg Muttitt, Dimitri Lafleur, Thijs Van de Graaf, Roman Mendelevitch, Lan Mei and Malte Meinshausen
Usage Terms: Creative Commons Attribution-Share Alike 3.0
License: CC-BY-SA-3.0
License Link: http://creativecommons.org/licenses/by-sa/3.0/
Attribution Required?: Yes
Image usage
The following page links to this image:
