
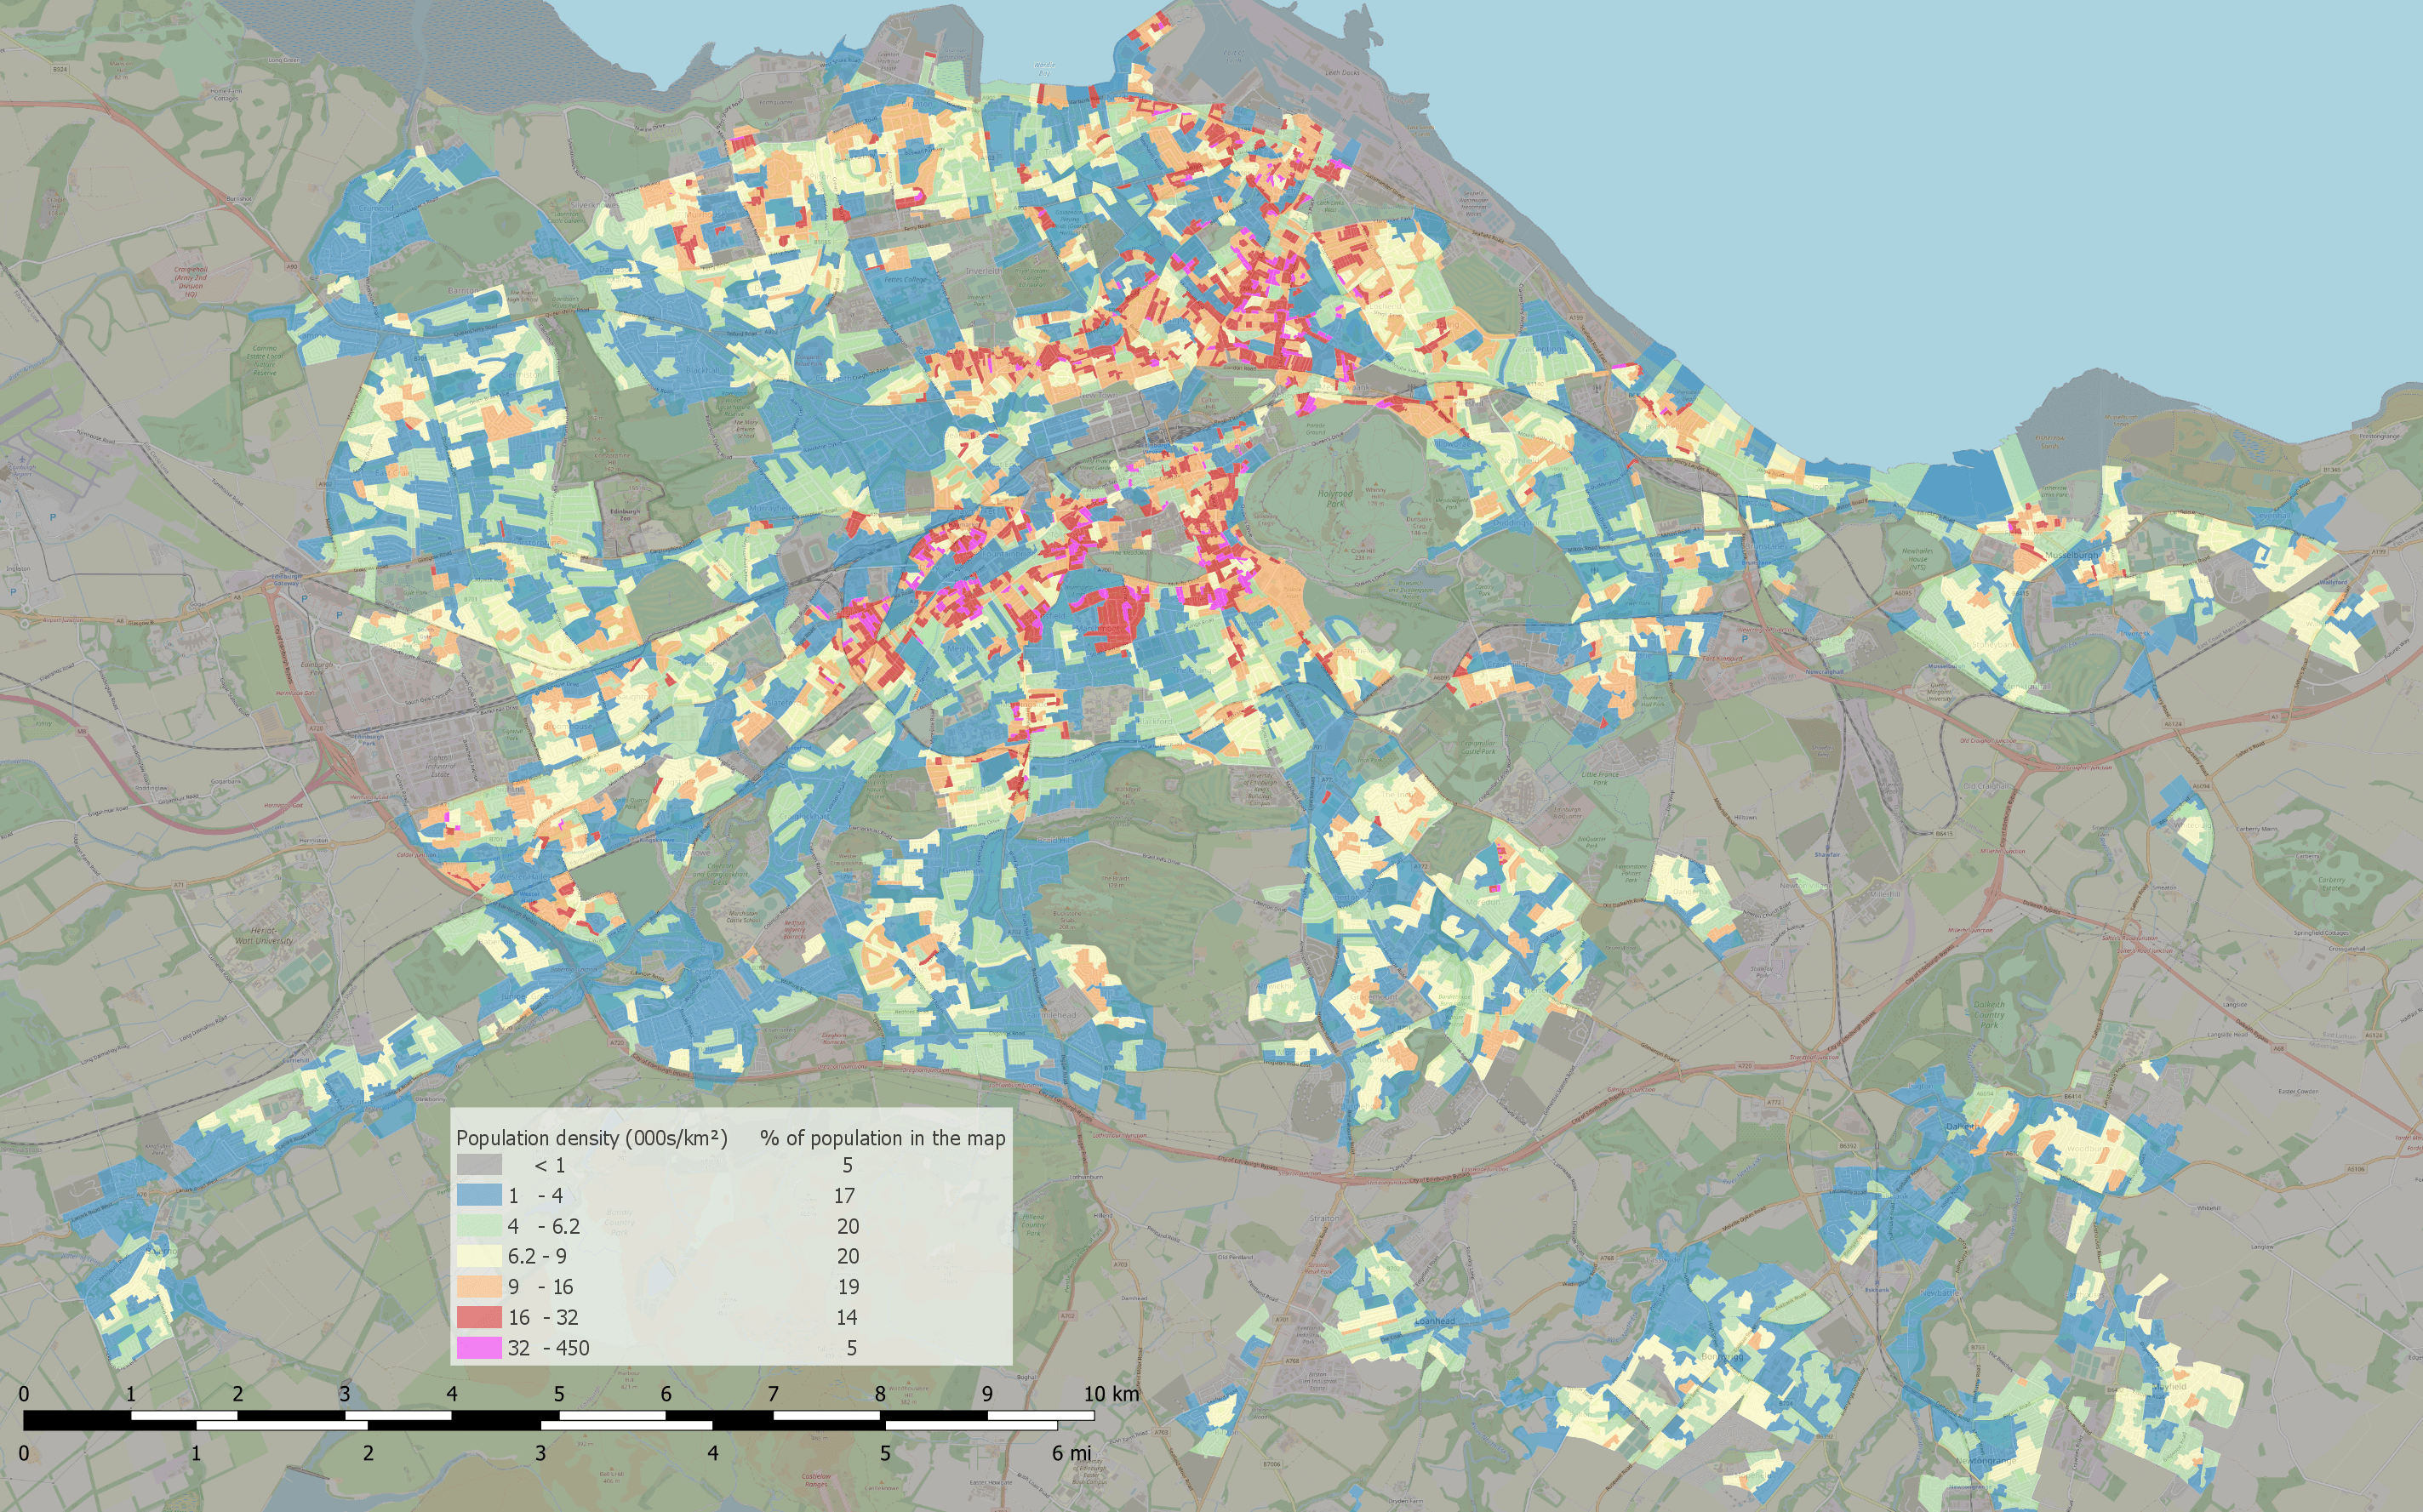
Image: Edinburgh population density map, 2011 census
Description: The map area was inhabited by 541,000 people. Population density computed from 2011 Output Area (OE) data there is on 2020 map so some new neighbourhoods are visible in the grey zone. Values sometimes are not representative because: sometimes a whole nonresidential area is contained in one from a few adjacent OEs. often tower block OEs encompass only building, sometimes only part of it, to keep up stiff household count limit, what gives very high density OE boundaries are visible, especially in red and pink. Polski: Obszar mapy zamieszkany był przez 541 tys. ludzi Gęstość zaludnienia w aglomeracji Edyburga obliczona z danych Output Area (OE) z 2011 i jest na mapie z 2020, tak więc widać niektóre nowe osiedla w szarej strefie. Wartości czasami nie są reprezentacyjne ponieważ: czasami cały obszar bez budownictwa mieszkaniowego jest zawarty w jednym z kilku sąsiadujących OE czasami OE wieżowców obejmuje tylko budynek, albo tylko jego część, żeby utrzymać sztywny limit domostw, co daje bardzo dużą gęstość Granice OE są widoczne, szczególnie w czerwieni i w różu.
Title: Edinburgh population density map, 2011 census
Credit: Own work based on: OpenStreetMap. National Records of Scotland (2011). 2011 Census: boundary data (Scotland) [data collection]. UK Data Service. SN:5819 UKBORDERS: Digitised Boundary Data, 1840- and Postcode Directories, 1980-. http://discover.ukdataservice.ac.uk/catalogue/?sn=5819&type=Data%20catalogue, Retrieved from http://census.ukdataservice.ac.uk/get-data/boundary-data.aspx. Contains public sector information licensed under the Open Government Licence v3.
Author: PawełS
Usage Terms: Creative Commons Attribution-Share Alike 2.0
License: CC BY-SA 2.0
License Link: https://creativecommons.org/licenses/by-sa/2.0
Attribution Required?: Yes
Image usage
The following page links to this image:
