Image: Eswatini GDP per capita chart

Size of this PNG preview of this SVG file: 800 × 565 pixels. Other resolution: 320 × 226 pixels.
Original image (SVG file, nominally 850 × 600 pixels, file size: 29 KB)
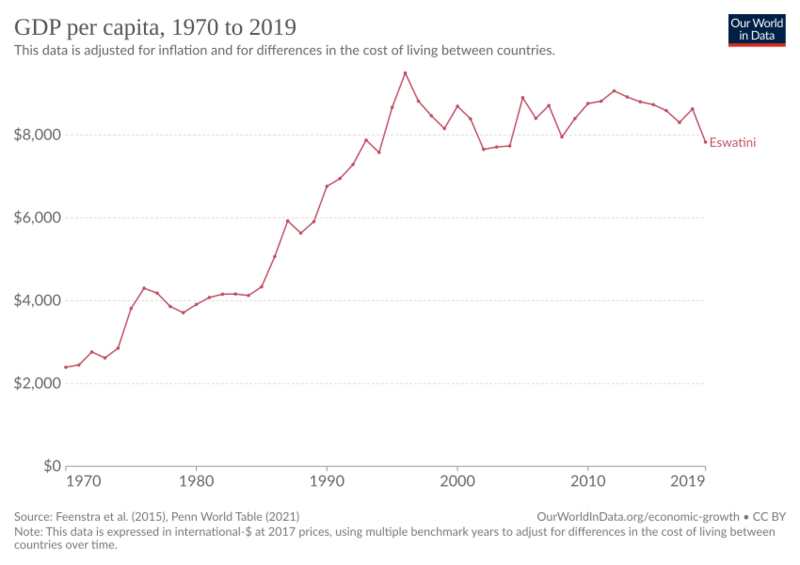
Description: Chart showing GDP per capita of Eswatini, 1970 to 2019.
This data is adjusted for inflation and for differences in the cost of living between countries.
Author: Chart generated by Our World in Data (Global Change Data Lab).
Data published by: Feenstra, R. C., Inklaar, R. and Timmer, M.P. (2015), "The Next Generation of the Penn World Table". American Economic Review, 105(10), 3150-3182 Global Change Data Lab (Data source)
Usage Terms: Creative Commons Attribution-Share Alike 3.0
License: CC-BY-SA-3.0
License Link: http://creativecommons.org/licenses/by-sa/3.0/
Attribution Required?: Yes
Image usage
The following page links to this image:

All content from Kiddle encyclopedia articles (including the article images and facts) can be freely used under Attribution-ShareAlike license, unless stated otherwise.
