
Image: Example IC50 curve demonstrating visually how IC50 is derived

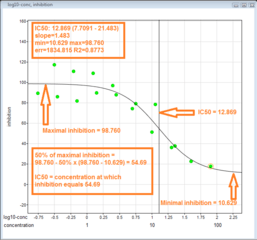
Description: Visual demonstration of how to derive IC50 value: Arrange data with activity (%) on vertical axis and log(concentration of inhibitor) on horizontal axis; then identify max and min inhibition; then the IC50 is the concentration at which the curve passes through the 50% inhibition level. Note: There is a slight error in the picture. Maximal inhibition would occur at the lowest part of the curve and minimum at the highest. Alternatively, it could be read as maximal activity on the left and minimal activity on the right. Also, the calculation, while correct, can be simplified: 50% of maximal inhibition = 50% X (98.760 + 10.629)
Title: Example IC50 curve demonstrating visually how IC50 is derived
Credit: Own work
Author: JesseAlanGordon
Usage Terms: Creative Commons Attribution-Share Alike 3.0
License: CC BY-SA 3.0
License Link: http://creativecommons.org/licenses/by-sa/3.0
Attribution Required?: Yes
Image usage
The following page links to this image:
