
Image: FTSE 100 index chart since 1984

Size of this preview: 800 × 466 pixels. Other resolutions: 320 × 186 pixels | 992 × 578 pixels.
Original image (992 × 578 pixels, file size: 23 KB, MIME type: image/png)
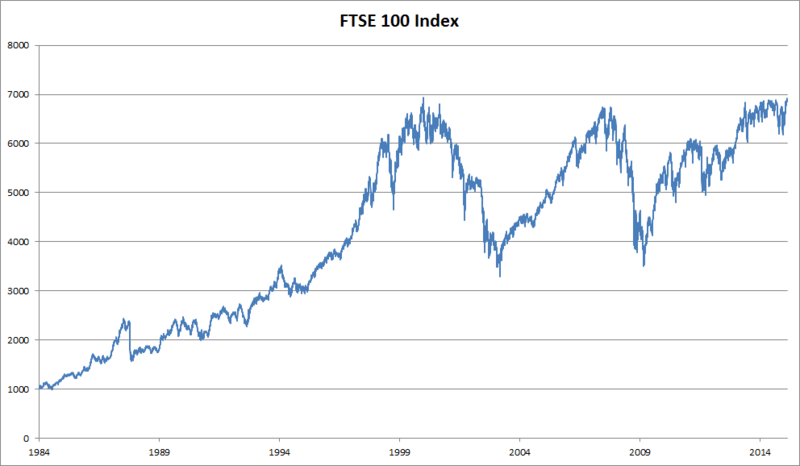
Description: Chart of the highs and lows of the FTSE 100 Index. It is different from the existing FTSE 100 Index.png because that one has misleading axes and data back further in the past, apparently before the FTSE 100 existed. Other information Chart by OpenOffice, Image by Gimp
Title: FTSE 100 index chart since 1984
Credit: Data is from Yahoo! Finance
Author: Thrapper
Usage Terms: Creative Commons Attribution-Share Alike 3.0
License: CC BY-SA 3.0
License Link: http://creativecommons.org/licenses/by-sa/3.0
Attribution Required?: Yes
Image usage
There are no pages that link to this image.

All content from Kiddle encyclopedia articles (including the article images and facts) can be freely used under Attribution-ShareAlike license, unless stated otherwise.