
Image: Gaia- Exploring the multi-dimensional Milky Way ESA24305488

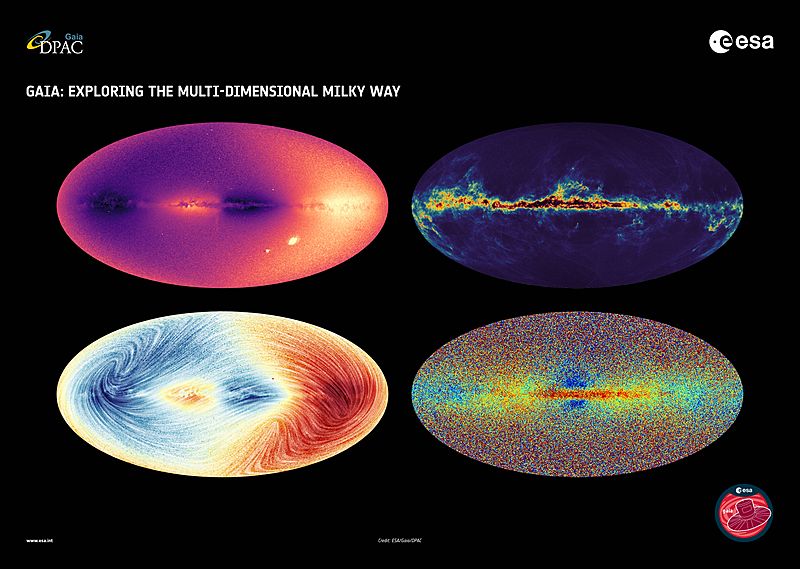
Description: This image shows four sky maps made with the new ESA Gaia data released on 13 June 2022. Click on the titles below to download the individual maps. Click here for a portrait version of this collage. 1. Radial velocity ESA’s Gaia data release 3 shows us the speed at which more than 30 million objects in the Milky Way (mostly stars) move towards or away from us. This is called ‘radial velocity’. We can now see how the objects move over a large portion of the Milky Way’s disc. The rotation of the disc, projected along the line-of-sight, is visible from the alternation of bright areas (moving away from us) and dark areas (moving toward us). Several objects whose radial velocity differs from that of their close environment are visible by contrast. The Large and Small Magellanic Clouds (LMC and SMC) appear as bright spots in the lower right corner of the image. The Sagittarius dwarf galaxy is visible as a faint quasi-vertical stripe below the Galactic Centre. Several globular clusters appear as tiny dots in the image, such as 47 Tucanae, the dark dot on the immediate left of the SMC. 2. Radial velocity and proper motion This sky map shows the velocity field of the Milky Way for ~26 million stars. The colours show the radial velocities of stars along the line-of-sight. Blue shows the parts of the sky where the average motion of stars is towards us and red shows the regions where the average motion is away from us. The lines visible in the figure trace out the motion of stars projected on the sky (proper motion). These lines show how the direction of the speed of stars varies by galactic latitude and longitude. The Large and Small Magellanic Clouds (LMC and SMC) are not visible as only stars with well defined distances were selected to make this image. 3. Interstellar dust Gaia not only maps the stars in our galaxy but tells us what is in between the stars. The space between stars is not empty but instead filled with dust and gas clouds, out of which stars are born. Through the precise measurements of the stars' positions and their dispersed light, Gaia allows us to map the absorption of the starlight by the interstellar medium. Those maps provide us with essential clues to the physical mechanisms of the formation of stars, galaxies, and the history of our home galaxy. This map shows the interstellar dust that fills the Milky Way. The dark regions in the centre of the Galactic plane in black are the regions with a lot of interstellar dust fading to the yellow as the amount of dust decreases.The dark blue regions above and below the Galactic plane are regions where there is little dust. 4. Chemical map What stars are made of can tell us about their birthplace and their journey afterwards, and therefore about the history of the Milky Way. With today’s data release, Gaia is bringing us a chemical map of the galaxy. With Gaia, we see that some stars in our galaxy are made of primordial material, while others like our Sun are made of matter enriched by previous generations of stars. Stars that are closer to the centre and plane of our galaxy are richer in metals than stars at larger distances. This all-sky view shows a sample of the Milky Way stars in Gaia’s data release 3. The colour indicates the stellar metallicity. Redder stars are richer in metals.
Title: Gaia- Exploring the multi-dimensional Milky Way ESA24305488
Credit: Gaia: Exploring the multi-dimensional Milky Way
Author: © ESA/Gaia/DPAC;
Usage Terms: Creative Commons Attribution-Share Alike 3.0 igo
License: CC BY-SA 3.0 igo
License Link: https://creativecommons.org/licenses/by-sa/3.0/igo/deed.en
Attribution Required?: Yes
Image usage
The following page links to this image:
