
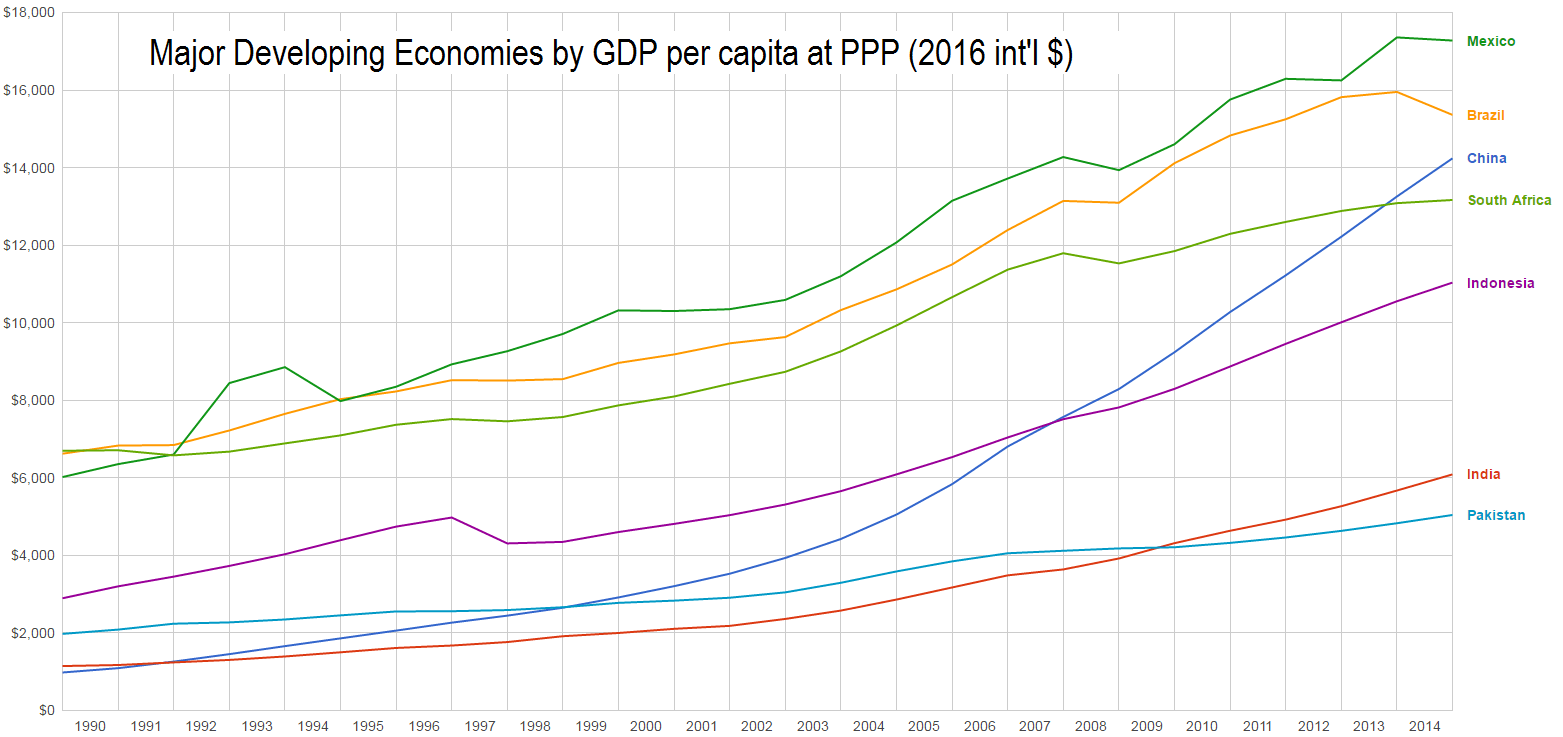
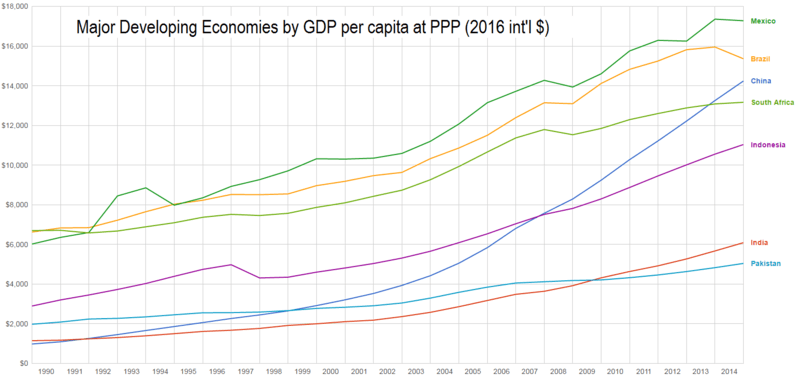
Image: Graph of Major Developing Economies by Real GDP per capita at PPP 1990-2013
Size of this preview: 800 × 377 pixels. Other resolutions: 320 × 151 pixels | 1,563 × 737 pixels.
Original image (1,563 × 737 pixels, file size: 94 KB, MIME type: image/png)
Description: Graph of major developing economies by GDP per capita at purchasing-power parity, in constant 2011 international dollars, 1990-2013. Created on Excel from World Bank World Development Indicators 2014 data.
Title: Graph of Major Developing Economies by Real GDP per capita at PPP 1990-2013
Credit: Created on Excel from World Bank World Development Indicators 2014 data
Author: CircleAdrian
Usage Terms: Creative Commons Attribution-Share Alike 3.0
License: CC BY-SA 3.0
License Link: http://creativecommons.org/licenses/by-sa/3.0
Attribution Required?: Yes
Image usage
The following 2 pages link to this image:

All content from Kiddle encyclopedia articles (including the article images and facts) can be freely used under Attribution-ShareAlike license, unless stated otherwise.