
Image: Graph of emissions by city
Size of this preview: 574 × 600 pixels. Other resolutions: 230 × 240 pixels | 600 × 627 pixels.
Original image (600 × 627 pixels, file size: 46 KB, MIME type: image/jpeg)
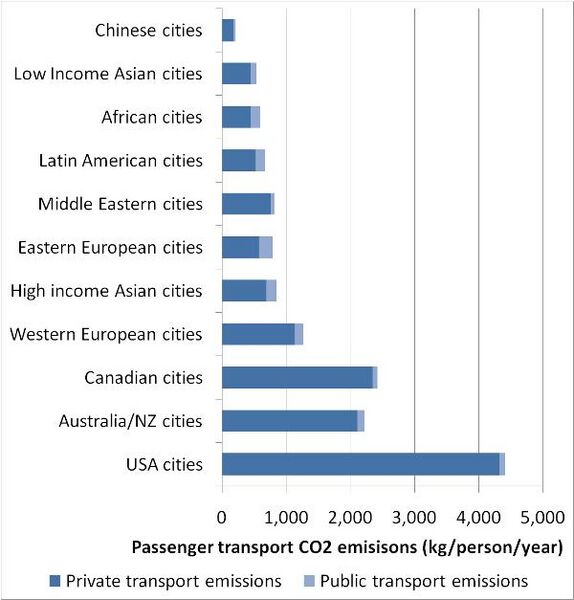
Description: Graph of CO2 emissions by city for the year 1995. Graph created by me from data published in Kenworthy, JR (2002) Transport Energy Use and Greenhouse Gases in Urban Passenger Transport Systems: A Study of 84 Global Cities / Millennium Cities Database UITP KENWORTHY JR*
Author: Travelplanner
Usage Terms: Creative Commons Attribution-Share Alike 3.0
License: CC-BY-SA-3.0
License Link: http://creativecommons.org/licenses/by-sa/3.0/
Attribution Required?: Yes
Image usage
The following page links to this image:

All content from Kiddle encyclopedia articles (including the article images and facts) can be freely used under Attribution-ShareAlike license, unless stated otherwise.