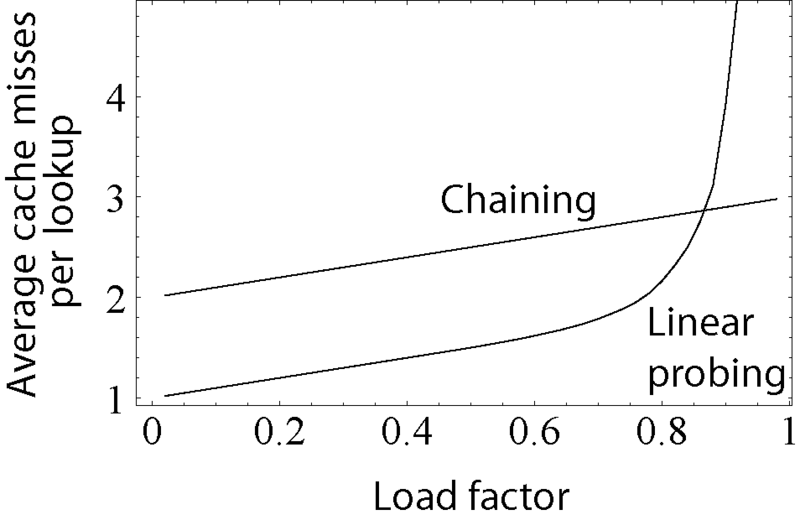
Image: Hash table average insertion time

Description: Shows the average number of cache misses expected when inserting into a hash table with various collision resolution mechanisms; on modern machines, this is a good estimate of actual clock time required. This seems to confirm the common heuristic that performance begins to degrade at about 80% table density. Created in Mathematica, Illustrator, and Photoshop. It is based on a simulated model of a hash table where the hash function chooses indexes for each insertion uniformly at random. The parameters of the model were: A table size of 1,000 elements. An L1 cache line size of 16 words, as on the Pentium 4. L2 cache effects are not accounted for. You may be curious what happens in the case where no cache exists. In other words, how does the number of probes (number of reads, number of comparisons) rise as the table fills? The curve is similar in shape to the one above, but shifted left: it requires an average of 24 probes for an 80% full table, and you have to go down to a 50% full table for only 3 probes to be required on average. This suggests that in the absence of a cache, ideally your hash table should be about twice as large for probing as for chaining.
Title: Hash table average insertion time
Credit: Author's Own Work.
Author: Derrick Coetzee (User:Dcoetzee)
Permission: I, the copyright holder of this work, release this work into the public domain. This applies worldwide. In some countries this may not be legally possible; if so: I grant anyone the right to use this work for any purpose, without any conditions, unless such conditions are required by law.
Usage Terms: Public domain
License: Public domain
Attribution Required?: No
Image usage
The following page links to this image:

