
Image: Ian Chappell graph
Size of this preview: 800 × 409 pixels. Other resolutions: 320 × 163 pixels | 963 × 492 pixels.
Original image (963 × 492 pixels, file size: 7 KB, MIME type: image/png)
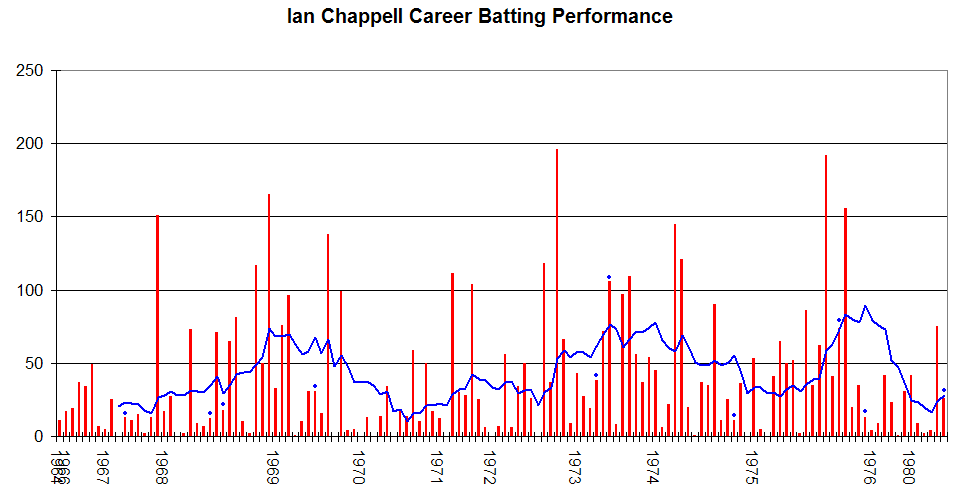
Description: This graph details the Test Match performance of Ian Chappell. It was created by Raven4x4x. The red bars indicate the player's test match innings, while the blue line shows the average of the ten most recent innings at that point. Note that this average cannot be calculated for the first nine innings. The blue dots indicate innings in which Chappell finished not-out. This graph was generated with Microsoft Excel 2002, using data from Cricinfo and Howstat.com.au.
Title: Ian Chappell graph
Credit: Own work Transferred from en.wikipedia
Author: Raven4x4x at en.wikipedia
Usage Terms: Public domain
License: Public domain
Attribution Required?: No
Image usage
The following page links to this image:

All content from Kiddle encyclopedia articles (including the article images and facts) can be freely used under Attribution-ShareAlike license, unless stated otherwise.