
Image: Map latitudinal gradient of biodiversity mannion 2014
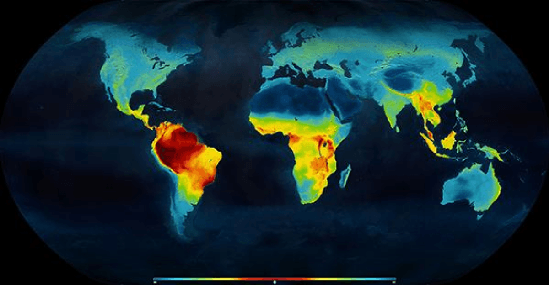
Description: example of latitudinal gradient of species diversity: distribution of living terrestrial vertebrate species, highest concentration of diversity shown in red in equatorial regions, declining polewards (towards the blue end of the spectrum)
Title: Map latitudinal gradient of biodiversity mannion 2014
Credit: Palaeontology [online] (www.palaeontologyonline.com): Mannion, P. D. 2014. Patterns in Palaeontology: The latitudinal biodiversity gradient. Palaeontology Online, Volume 4, Article 3, 1-8.
Author: Mannion, P. D., Upchurch, P., Benson, R. B. J. & Goswami, A., based on work by Clinton Jenkins
Usage Terms: Creative Commons Attribution 3.0
License: CC BY 3.0
License Link: https://creativecommons.org/licenses/by/3.0
Attribution Required?: Yes
Image usage
The following page links to this image:
