
Image: Monthly arthropod abundance in central Kruger National Park
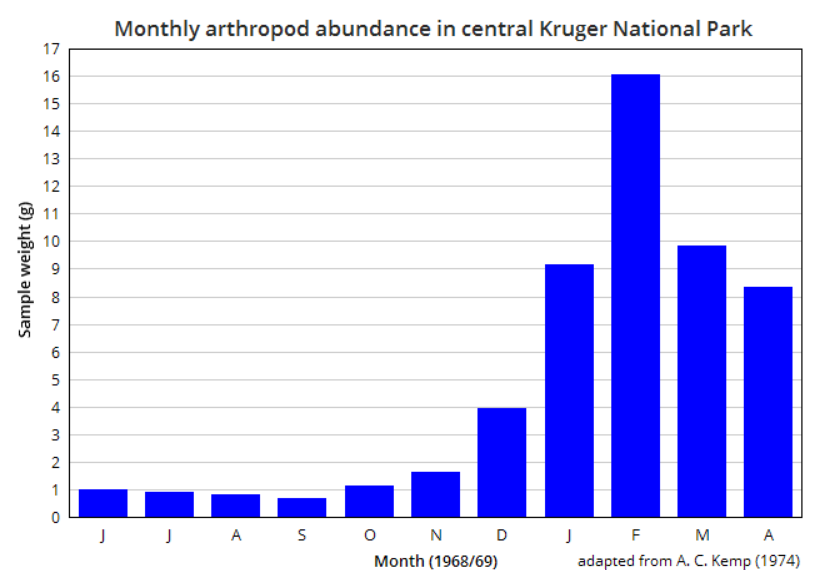
Description: Graph adapted from Kemp (1974): Monthly biomass of arthropods sampled in the central Kruger National Park. The data set covers a period of 11 months (1968/69). The average weight of routine sweeps were calculated, which were carried out every third day in two sample areas of the Satara grasslands.[1] Summer rain during the sample period started in October, but there was some winter rain as well. Data set on edit page.
Author: JMK, graph adapted from data set obtained by Kemp (1974), charted using ChartGo, an easy to use online chart tool
Usage Terms: Creative Commons Attribution-Share Alike 3.0
License: CC-BY-SA-3.0
License Link: http://creativecommons.org/licenses/by-sa/3.0/
Attribution Required?: Yes
Image usage
The following page links to this image:
