
Image: Mouvement des planètes au cours du temps

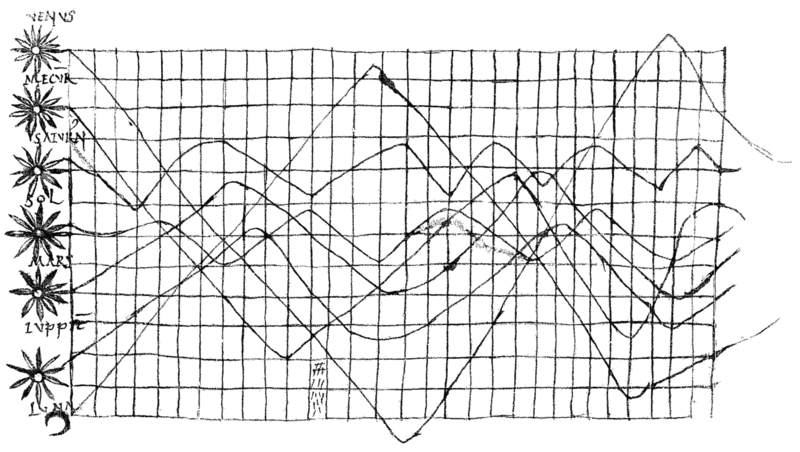
Description: Planetary Movements, depicted as Cyclic Lines on a Spacial-Temporal Grid. In De cursu zodiacum (by Pliny?), given as an appendix to a copy of Macrobius' Commentary on Cicero's Somnium Scipionis (CLM 14436, a convolute of four mss. of the late 10th and early 11th century for use in monastery schools; substantial portions are written by one Hartwic) This is the earliest known 2-dimensional charts (plotting time vs. celestial latitude; an apparent anomaly is that it appears to show the celestial latitude of the sun varying with time); the scribe used horizontal and vertical lines as aids, resulting in a picture strikingly similar to modern graph paper as it did not become commonly used before the mid 19th century, some 700 years later. This picture is a notable anomaly, as the earliest comparable "graph" diagram do not emerge prior to the late medieval period, some 250 years after this drawing was made. The graph was first described by Günther (1877). Literature S. Günther, "Die Anfänge und Entwickelungsstadien des Coordinatenprincipes", Abhandlungen der naturhistorischen Gesellschaft zu Nürnberg VI (1877) p. 19 H. G. Funkhouser, "A note on a tenth century graph", Osiris 1 (1936), 260-262. James R. Beniger and Dorothy L. Robyn (1978). "Quantitative graphics in statistics: A brief history", The American Statistician 32 (1978), 1–11.
Title: Mouvement des planètes au cours du temps
Credit: Commentarii in Somnium Scipionis, A.T. Macrobius. CLM 14436 fol. 61r, reproduced in Funkhouser (1936), immediate source here (fisme.science.uu.nl)
Author: AnonymousUnknown author
Usage Terms: Public domain
License: Public domain
Attribution Required?: No
Image usage
The following page links to this image:
