
Image: North American Temperature Anomaly March 2012

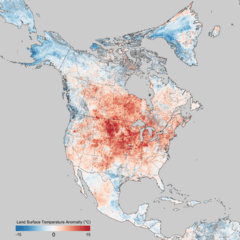
Description: The map depicts land surface temperatures of March 8-15 compared to the average of the same eight day period from 2000-2011. Areas with warmer than average temperatures are shown in red; near-normal temperatures are white; and areas that were cooler than the 2000-2011 base period are blue. Land surface temperatures are distinct from the air temperatures that meteorological stations typically measure. LSTs indicate how hot the surface of the Earth in a particular location would feel to the touch. From a satellite vantage point, the “surface” includes a number of materials that capture and retain heat, such as sand in the desert, the dark roof of a building, or the pavement of a road. As a result, daytime land surface temperature are usually much higher than air temperatures—something that anyone who has walked barefoot across a parking lot on a summer afternoon knows instinctively.
Title: North American Temperature Anomaly March 2012
Credit: http://eoimages.gsfc.nasa.gov/images/imagerecords/77000/77465/namericalsta_tmo_2012068_lrg.png http://earthobservatory.nasa.gov/IOTD/view.php?id=77465
Author: NASA Earth Observatory image by Jesse Allen, using data from the Level 1 and Atmospheres Active Distribution System (LAADS)
Usage Terms: Public domain
License: Public domain
Attribution Required?: No
Image usage
The following page links to this image:
