
Image: Pfeffer-Tabelle9

Size of this PNG preview of this SVG file: 800 × 600 pixels. Other resolution: 320 × 240 pixels.
Original image (SVG file, nominally 800 × 600 pixels, file size: 16 KB)
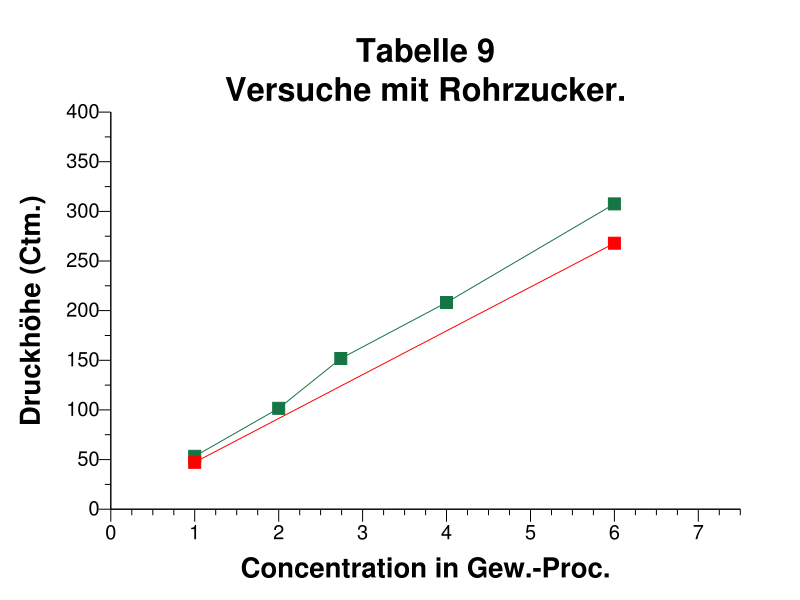
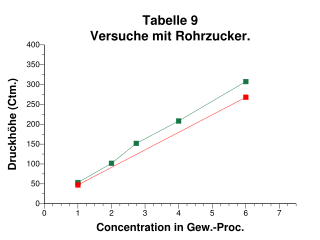
Description: Table 9 from Wilhelm Pfeffer's "Osmotische Untersuchungen", 1877, p. 81. These data were later used by Jacobus Henricus van ’t Hoff in his work "The Function of Osmotic Pressure in the Analogy between Solutions and Gases", 1888. Shown are two series at a temperature range between 13.5 to 16.1 °C. Pfeffer employed a air-quicksilver manometre to determine pressure levels ("Druckhöhe").
Title: Pfeffer-Tabelle9
Credit: Own work
Author: Drahkrub
Usage Terms: Creative Commons Attribution-Share Alike 3.0
License: CC BY-SA 3.0
License Link: https://creativecommons.org/licenses/by-sa/3.0
Attribution Required?: Yes
Image usage
The following page links to this image:

All content from Kiddle encyclopedia articles (including the article images and facts) can be freely used under Attribution-ShareAlike license, unless stated otherwise.