
Image: Price-Earnings Ratios as a Predictor of Twenty-Year Returns (Shiller Data)

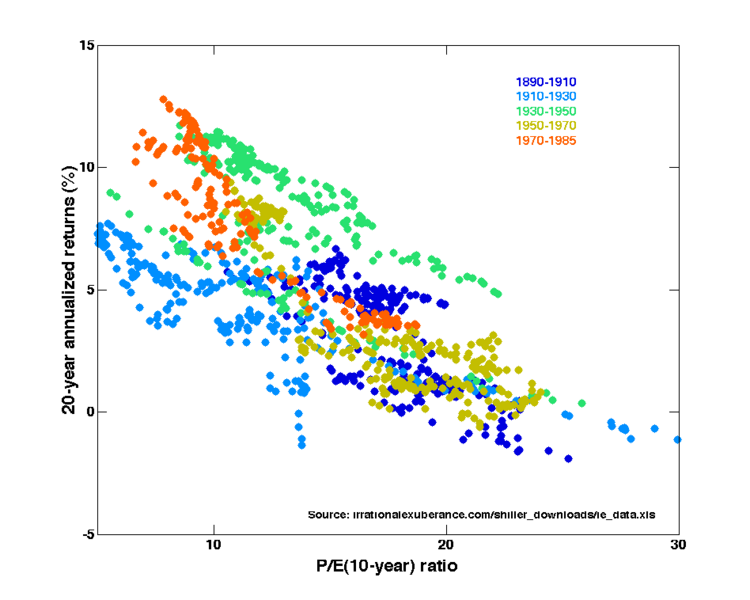
Description: Price-Earnings Ratios as a Predictor of Twenty-Year Returns: A twenty-year modification of the plot by Robert Shiller (Figure 10.1 from Shiller, Robert (2005) Irrational Exuberance (2d ed.), Princeton University Press ISBN 0-691-12335-7) using data from irrationalexuberance.com/shiller_downloads/ie_data.xls. The horizontal axis shows the real price-earnings ratio of the S&P Composite Stock Price Index as computed in Irrational Exuberance (inflation adjusted price divided by the prior ten-year mean of inflation-adjusted earnings). The vertical axis shows the geometric average real annual return on investing in the S&P Composite Stock Price Index, reinvesting dividends, and selling twenty years later. Data from different twenty year periods is color-coded as shown in the key. See also Image:Price-Earnings Ratios as a Predictor of Ten-Year Returns (Shiller Data).png.
Title: Price-Earnings Ratios as a Predictor of Twenty-Year Returns (Shiller Data)
Credit: Own work
Author: Stsmith
Usage Terms: Creative Commons Attribution-Share Alike 4.0
License: CC BY-SA 4.0
License Link: https://creativecommons.org/licenses/by-sa/4.0
Attribution Required?: Yes
Image usage
The following page links to this image:

.png)