
Image: Psychometric chart example of Salt Lake City
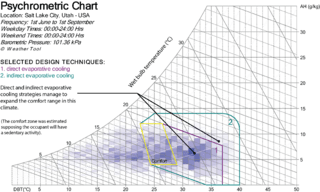
Size of this preview: 800 × 479 pixels. Other resolutions: 320 × 192 pixels | 3,379 × 2,023 pixels.
Original image (3,379 × 2,023 pixels, file size: 849 KB, MIME type: image/png)
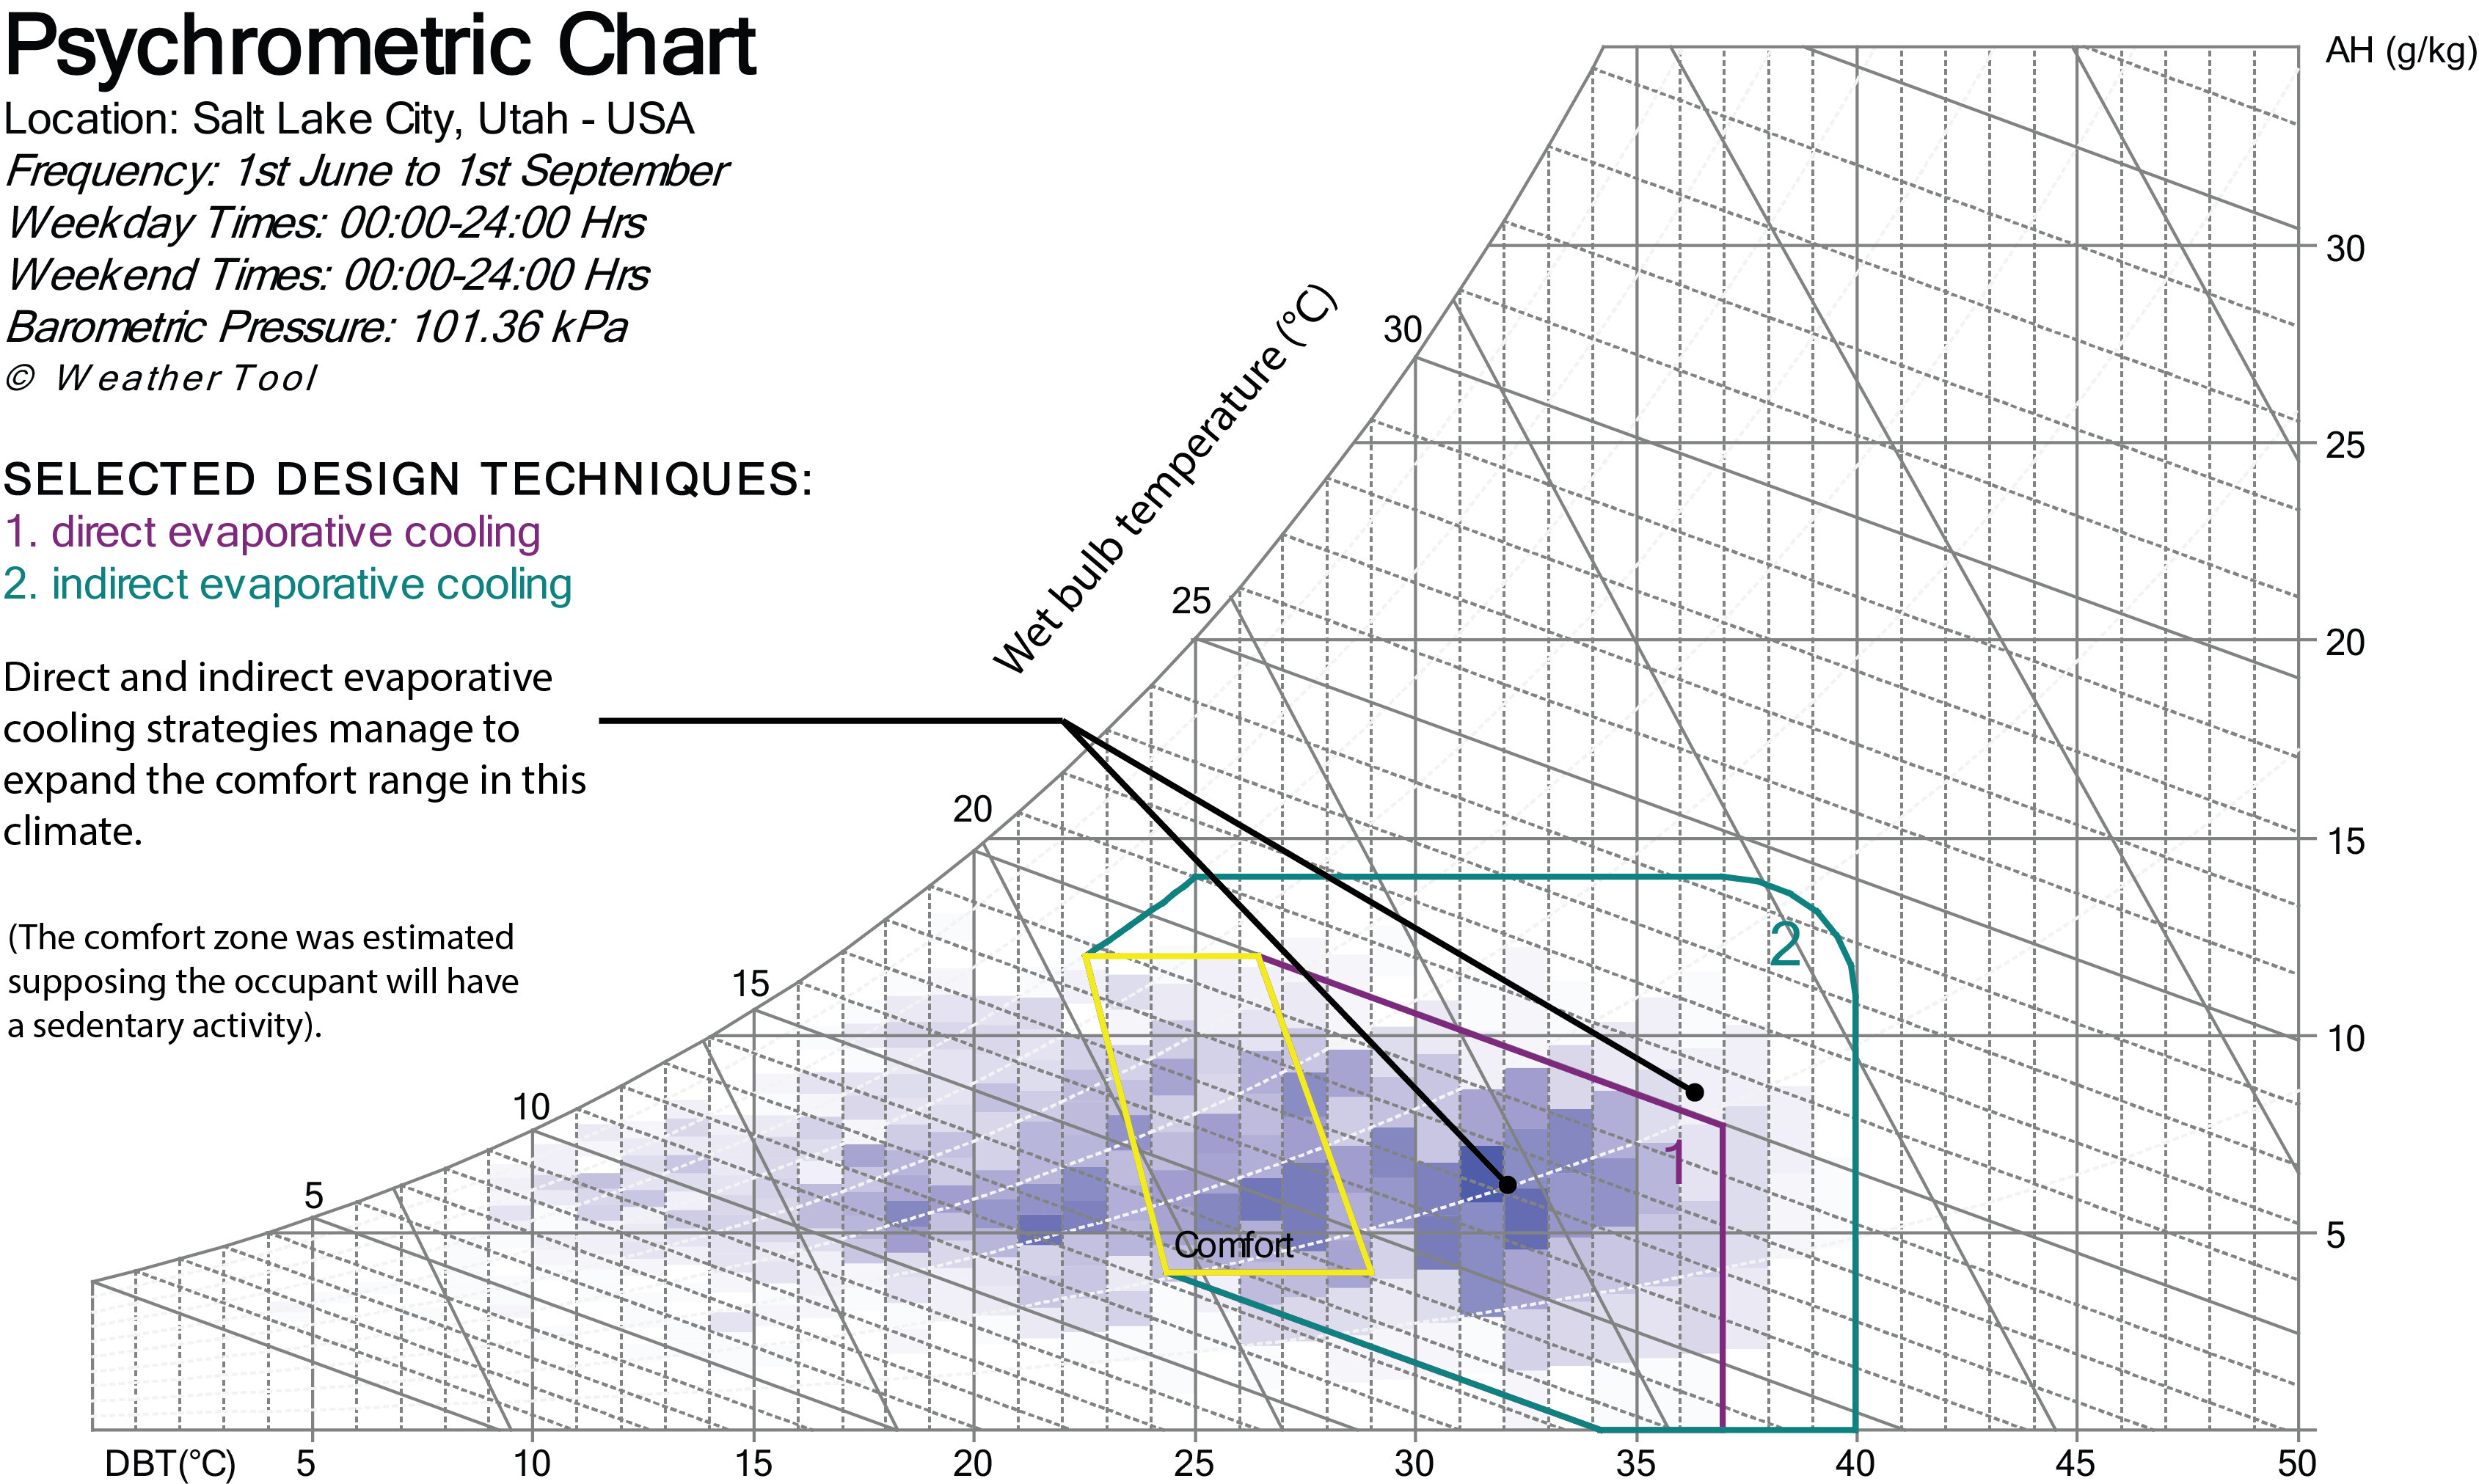
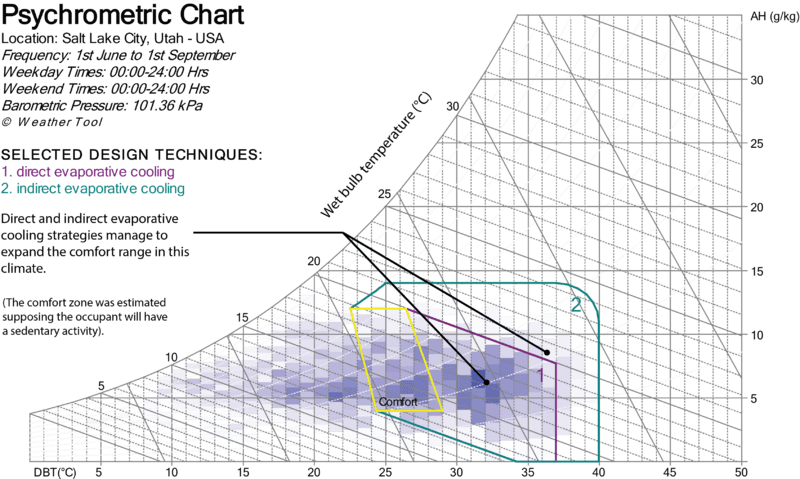
Description: Psychrometric chart example of Salt Lake City from Autodesk Ecotect. The blue cells represent distribution of typical annual climate. Acceptable climate conditions for direct and indirect evaporative cooling are outlined in green and purple, respectively.
Title: Psychometric chart example of Salt Lake City
Credit: Autodesk Weather Tool software
Author: Soazig Kaam
Usage Terms: Creative Commons Attribution 3.0
License: CC BY 3.0
License Link: http://creativecommons.org/licenses/by/3.0
Attribution Required?: Yes
Image usage
The following 2 pages link to this image:

All content from Kiddle encyclopedia articles (including the article images and facts) can be freely used under Attribution-ShareAlike license, unless stated otherwise.