
Image: Ray Lindwall graph
No higher resolution available.
Ray_Lindwall_graph.png (667 × 428 pixels, file size: 5 KB, MIME type: image/png)
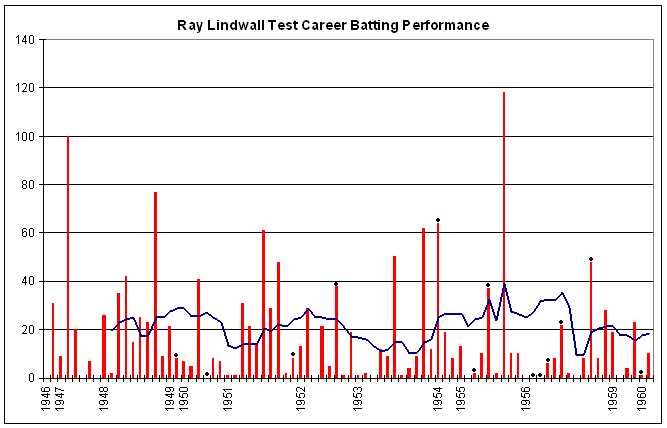
Description: Test batting chart of Ray Lindwall. Red columns are the runs in the innings. Blue dots indicate not outs. Blue line is average in the last ten innings. Thanks to Raven4x4x for providing the template.
Title: Ray Lindwall graph
Credit: Own work Transferred from en.wikipedia
Author: YellowMonkey at en.wikipedia
Usage Terms: Creative Commons Attribution-Share Alike 3.0
License: CC BY-SA 3.0
License Link: http://creativecommons.org/licenses/by-sa/3.0/
Attribution Required?: Yes
Image usage
The following page links to this image:

All content from Kiddle encyclopedia articles (including the article images and facts) can be freely used under Attribution-ShareAlike license, unless stated otherwise.