
Image: Square Pie Chart - Waffle Chart
No higher resolution available.
Square_Pie_Chart_-_Waffle_Chart.jpg (378 × 300 pixels, file size: 82 KB, MIME type: image/jpeg)
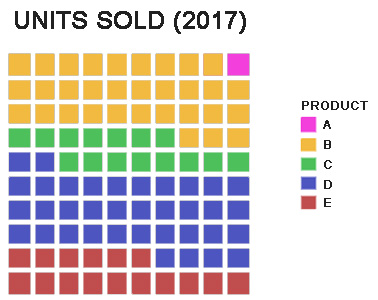
Description: Depicts a Square Pie Chart, also known as a Waffle Chart. They look like grids and are usually 10x10, where each cell represents 1%. However they can be any shape, from circles, to pictograms, or other shapes. The benefit is that they are easier to read smaller percentages than on circular pie graphs.
Title: Square Pie Chart - Waffle Chart
Credit: Own work
Author: 4jonah
Usage Terms: Creative Commons Attribution-Share Alike 4.0
License: CC BY-SA 4.0
License Link: https://creativecommons.org/licenses/by-sa/4.0
Attribution Required?: Yes
Image usage
The following page links to this image:

All content from Kiddle encyclopedia articles (including the article images and facts) can be freely used under Attribution-ShareAlike license, unless stated otherwise.