
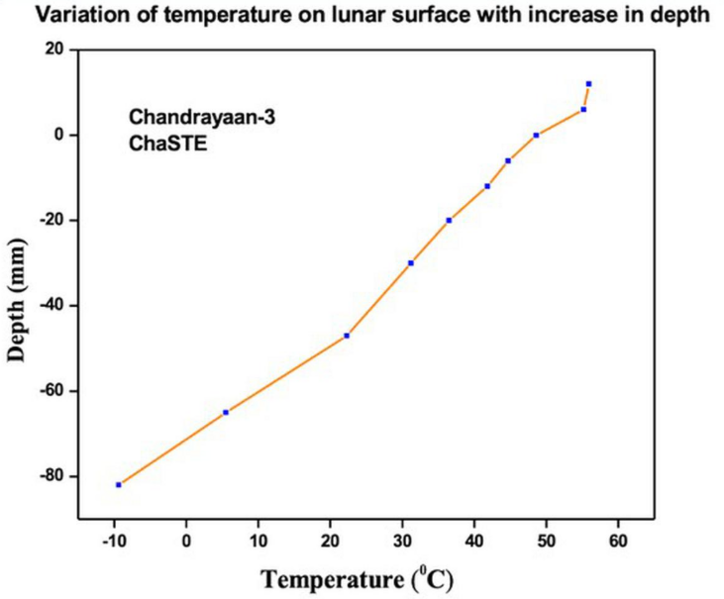
Image: The graph of temperature variation across the lunar topsoil at a point in the solar polar region, as measured by the ChaSTE instrument

Size of this preview: 724 × 599 pixels. Other resolutions: 290 × 240 pixels | 731 × 605 pixels.
Original image (731 × 605 pixels, file size: 123 KB, MIME type: image/png)
Description: The presented graph illustrates the temperature variations of the lunar surface/near-surface at various depths, as recorded during the Chandrayaan-3 probe's penetration. This is the first such profile for the lunar south pole. Detailed observations are underway.
Author: Indian Space Research Organisation (ISRO)
Usage Terms: Creative Commons Attribution-Share Alike 3.0
License: CC-BY-SA-3.0
License Link: http://creativecommons.org/licenses/by-sa/3.0/
Attribution Required?: Yes
Image usage
The following page links to this image:

All content from Kiddle encyclopedia articles (including the article images and facts) can be freely used under Attribution-ShareAlike license, unless stated otherwise.