
Image: U.S. Employment Changes - Total Non-Farm 1970 to Present

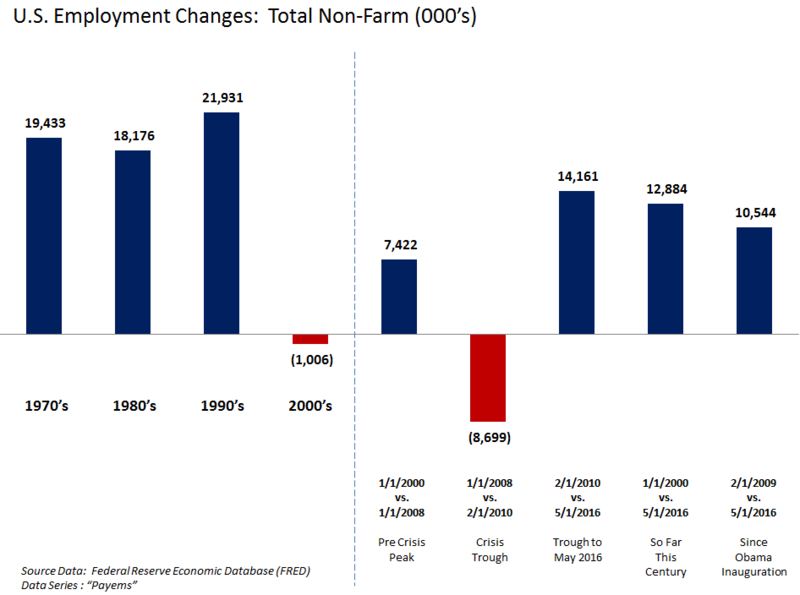
Description: This chart shows U.S. employment changes, a proxy for net new job creation, from 1970 to present. Interpreting the chart data The data is from the FRED database, specifically the PAYEMS data series.[1] The data included in the chart can be downloaded from FRED and analyzed. This is total non-farm employment, both government and civilian. This chart shows changes in employment measured from various points. Note the chart is measured in thousands (i.e., add three zeroes to each measure). The amounts shown to the left of the dotted line show differences between the starting point and end-point of the decade. For example, the 1970s column shows the change between 1/1/1970 and 12/1/1979, a difference of 19,433,000 employed. The U.S. added roughly 20 million jobs in each of the three decades 1970-2000. However, job growth post-2000 was anemic (even pre-recession). No net new jobs were added measured from the start and end points of the decade. Economists debate the causes, but some include globalization, technology, supply chain innovation that allowed global sourcing and off-shoring, the rise of China, and the subprime mortgage crisis as factors. Globalization and technology have allowed millions of people to compete on the global stage that did not prior to 2000.[2] The items to the right of the dotted line represent selected periods helpful to understanding the jobs debate. From January 1, 2000 to January 1, 2008 (the pre-recession peak employment), about 7.4 million net new jobs were created, rather anemic by historical standards. From the pre-recession peak (January 1, 2008) to the post-recession trough or low point (February 1, 2010), employment was reduced by 8.7 million jobs, about 6.4% of the labor force. From February 1, 2009 (President Obama's inauguration was mid-month January) to May 2016, U.S. employment increased by 10.5 million. From February 1, 2010 (the post-recession trough or employment low-point) to May 2016, U.S. employment increased by 14.1 million.[3] Other helpful employment charts Jobs by month Calculated Risk-September Employment Report
Title: U.S. Employment Changes - Total Non-Farm 1970 to Present
Credit: I used data from the FRED Database to create the chart
Author: Farcaster
Usage Terms: Creative Commons Attribution-Share Alike 3.0
License: CC BY-SA 3.0
License Link: http://creativecommons.org/licenses/by-sa/3.0
Attribution Required?: Yes
Image usage
There are no pages that link to this image.
