
Image: U.S. GDP Contribution to Change 2007-2009
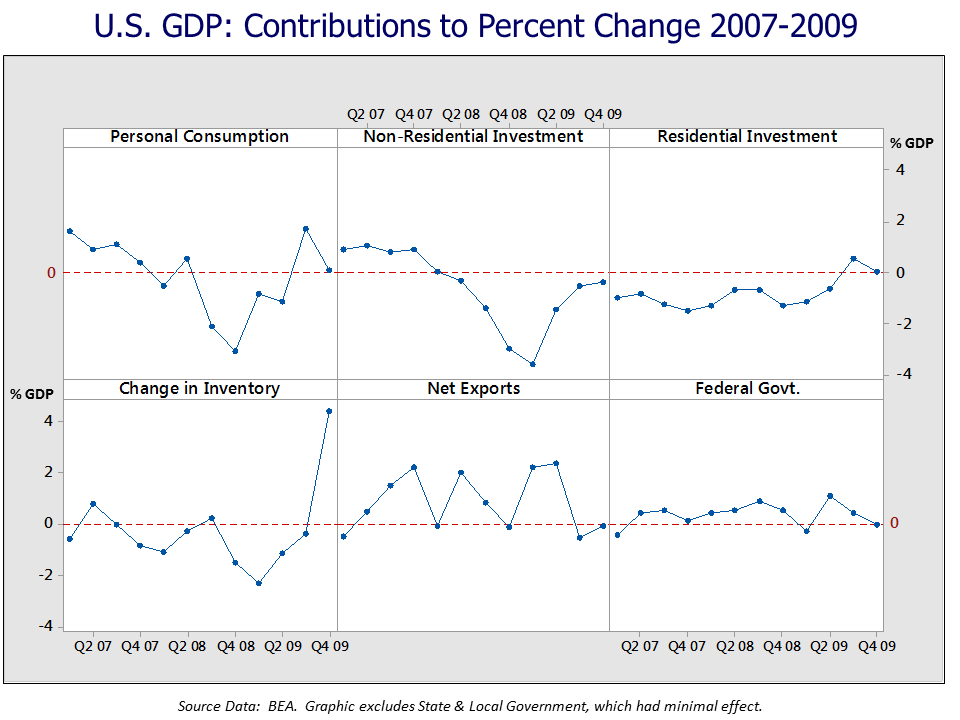
Description: This small multiple chart or panel chart shows six of the major components of GDP and how they contributed to the percent change in real GDP each quarter over the 2007-2009 period. The change in state and local spending had minimal impact; the six components are otherwise a complete accounting of the change. For example, in Q4 2008 real GDP declined 8.3%. Personal consumption expenditures represented -3.08, nonresidential fixed investment -3.00, Residential -1.29, change in inventory -1.45, net exports -.08, federal spending +.56, state and local spending +0. Source data is Table 1.1.2 "Contributions to Percent Change in Real Domestic Product". Click on "modify" and indicate the 2007-2009 date range for the information in the table. The graph was created using Minitab software.
Title: U.S. GDP Contribution to Change 2007-2009
Credit: Created using BEA GDP Contribution Data Source Data: http://bea.gov/iTable/iTable.cfm?ReqID=9&step=1#reqid=9&step=3&isuri=1&903=2
Author: Farcaster
Usage Terms: Creative Commons Attribution-Share Alike 3.0
License: CC BY-SA 3.0
License Link: http://creativecommons.org/licenses/by-sa/3.0
Attribution Required?: Yes
Image usage
The following page links to this image:
