
Image: Virender Sehwag Graph
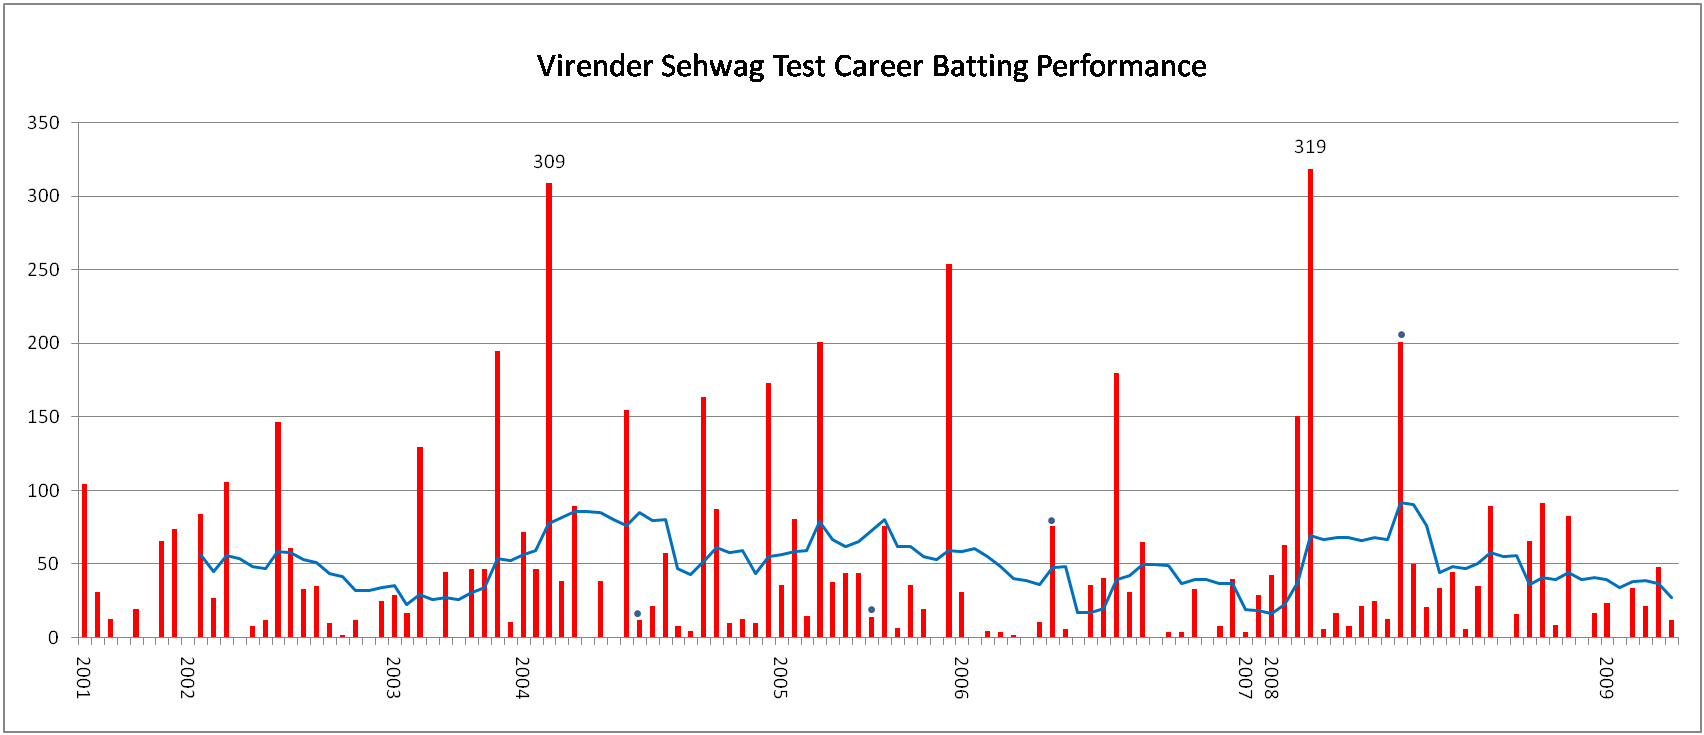
Description: This graph details the Test Match performance of Virender Sehwag. The red bars indicate the player's test match innings, while the blue line shows the average of the ten most recent innings at that point. Note that this average cannot be calculated for the first nine innings. The blue dots indicate those innings in which Sehwag finished not-out. This graph was generated with Microsoft Excel 2007 and Microsoft PowerPoint 2007, using data from Cricinfo [1]. The information in this chart is current as of 11 May, 2009.
Title: Virender Sehwag Graph
Credit: Transferred from en.wikipedia by SreeBot
Author: It was created originally by Raven4x4x and updated on 11th May, 09 by Rohit Pandey.
Usage Terms: Public domain
License: Public domain
Attribution Required?: No
Image usage
The following page links to this image:
