
Image: World oil consumption 1980 to 2007 by region

Size of this PNG preview of this SVG file: 600 × 450 pixels. Other resolution: 320 × 240 pixels.
Original image (SVG file, nominally 600 × 450 pixels, file size: 101 KB)
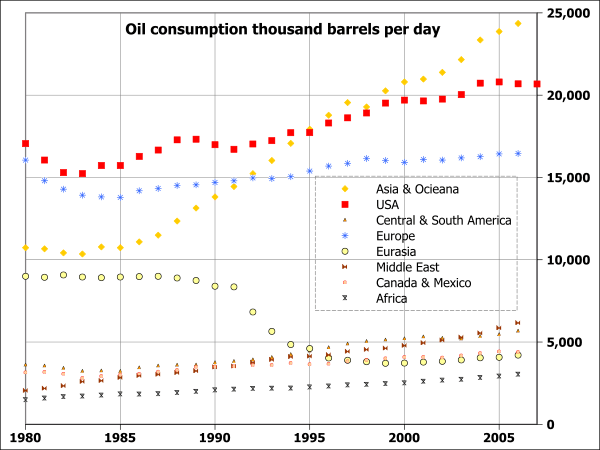
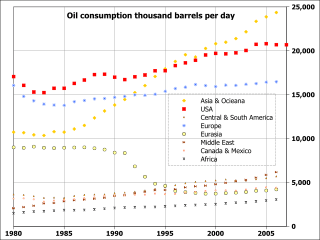
Description: Daily oil consumption by region from 1980 to 2006; vertical scale shows thousands of barrels per day, and the horizontal scale shows years from 1980 to 2007.
Title: World oil consumption 1980 to 2007 by region
Credit: I, 84user, created this work using the excel file RecentPetroleumConsumptionBarrelsperDay.xls from the U.S. Energy Information Administration's web page http://tonto.eia.doe.gov/dnav/pet/pet_pri_wco_k_w.htm (direct link: http://www.eia.doe.gov/emeu/international/RecentPetroleumConsumptionBarrelsperDay.xls) and using Open Source Gnumeric 1.9.1 to produce the chart
Author: 84user (talk)
Usage Terms: Public domain
License: Public domain
Attribution Required?: No
Image usage
The following page links to this image:

All content from Kiddle encyclopedia articles (including the article images and facts) can be freely used under Attribution-ShareAlike license, unless stated otherwise.