Image: ZhaopingZhe2015Fig1 pcbi.1004375.g001
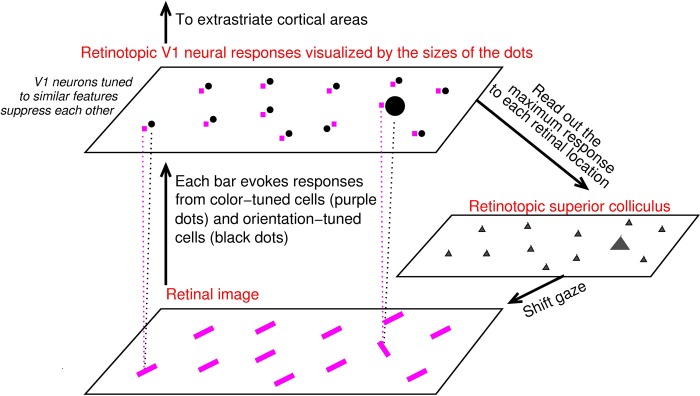
Description: V1 saliency hypothesis states that the bottom-up saliency of a location is represented by the maximum V1 response to this location.In this schematic, V1 is simplified to contain only two kinds of neurons, one tuned to color (their responses are visualized by the purple dots) and the other tuned to orientation (black dots). Each input bar evokes responses in a cell tuned to its color and another cell tuned to its orientation (indicated for two input bars by linking each bar to its two evoked responses by dotted lines), and the receptive fields of these two cells cover the same bar location even though (for better visualization) the dots representing these cells are not overlapping in the cortical map. Iso-feature suppression makes nearby V1 neurons tuned to similar features (e.g., similar color or similar orientation) suppress each other. The orientation singleton in this image evokes the highest V1 response to this image because the orientation-tuned neuron responding to it escapes iso-orientation suppression. The color tuned neuron tuned and responding to the singleton’s color is under iso-color suppression. The saliency map is likely read out by the superior colliculus to execute gaze shifts to salient locations (see Zhaoping L. Understanding Vision: theory, models, and data. Oxford University Press; 2014.)
Title: ZhaopingZhe2015Fig1 pcbi.1004375.g001
Credit: Own work
Author: Zhaopingli
Usage Terms: Creative Commons Attribution-Share Alike 4.0
License: CC BY-SA 4.0
License Link: https://creativecommons.org/licenses/by-sa/4.0
Attribution Required?: Yes
Image usage
The following page links to this image:


