Langleyville, Illinois facts for kids
Quick facts for kids
Langleyville, Illinois
|
|
|---|---|
| Country | United States |
| State | Illinois |
| County | Christian |
| Area | |
| • Total | 0.39 sq mi (1.02 km2) |
| • Land | 0.39 sq mi (1.02 km2) |
| • Water | 0.00 sq mi (0.00 km2) |
| Elevation | 604 ft (184 m) |
| Population
(2020)
|
|
| • Total | 391 |
| • Density | 994.91/sq mi (384.21/km2) |
| Time zone | UTC-6 (Central (CST)) |
| • Summer (DST) | UTC-5 (CDT) |
| Area code(s) | 217 |
| GNIS feature ID | 2629875 |
| FIPS code | 17-42002 |
Langleyville, also known as Calloway, is a small community in Christian County, Illinois, United States. It is an unincorporated census-designated place. This means it's an area identified by the U.S. Census Bureau for statistical purposes, but it doesn't have its own local government like a city or town. In 2020, about 391 people lived there.
Contents
Where is Langleyville?
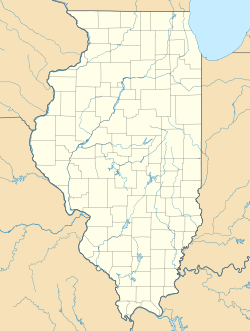
Langleyville is located in the state of Illinois. You can find it at these coordinates: 39°33′40″N 89°21′37″W / 39.561107°N 89.360255°W.
Size of the Area
According to information from 2021, Langleyville covers a total area of about 0.39 square miles (which is about 1.02 square kilometres). All of this area is land, with no water.
Who Lives in Langleyville?
| Historical population | |||
|---|---|---|---|
| Census | Pop. | %± | |
| 2010 | 432 | — | |
| 2020 | 391 | −9.5% | |
| U.S. Decennial Census | |||
As of the 2020 census, there were 391 people living in Langleyville. This population was spread across 191 households, with 147 of them being families. The area had about 995 people per square mile.
Population Details
Most of the people in Langleyville (about 91.56%) were White. There were also small percentages of Native American, Asian, and people from other races. About 7.42% of the population identified as being from two or more races. A small number (0.51%) were Hispanic or Latino.
Households and Families
Out of the 191 households, about 29.8% had children under 18 years old living with them. More than half (56.54%) were married couples. About 20.42% of households had a female head with no husband present. Around 23.04% of households were made up of people living alone, and some of these (23.04%) were individuals aged 65 or older.
The average household in Langleyville had about 2.52 people, and the average family had about 2.30 people.
Age Groups
The population of Langleyville has a variety of age groups:
- About 25.1% of residents were under 18 years old.
- About 18.9% were between 25 and 44 years old.
- About 20.8% were between 45 and 64 years old.
- A significant portion, 35.3%, were 65 years of age or older.
The average age in Langleyville was 53.5 years.
Income Information
In Langleyville, the average income for a household was $60,221 per year. For families, the average income was $62,279. The average income per person in the community was $28,541. No one in the population was reported to be below the poverty line.
See also
 In Spanish: Langleyville para niños


