
Demographics of Nova Scotia facts for kids
Nova Scotia (Latin for New Scotland; French: Nouvelle-Écosse; Scottish Gaelic: Alba Nuadh) is a Canadian province located on Canada's southeastern coast. It is the most populous province in the Atlantic Canada, and its capital, Halifax, is a major economic centre of the region. Nova Scotia is the second smallest province in Canada, with an area of 55,284 km². Its population of 921,727 makes it the fourth least populous province of the country.
Contents
Population
Nova Scotia is the seventh most populous province in Canada with an estimated 957,600 residents as of 2017. It accounts for 3 percent of the population of Canada. The population density is approximately 17.2 persons/km². Roughly 60% of the population live in rural parts of the province.
Regional municipalities
Nova Scotia has three regional municipalities.
| Name | Population (2016) |
Population (2011) |
Change (%) |
Area (km²) |
Population density |
|---|---|---|---|---|---|
| Cape Breton | 94,285 | 97,398 | -3.2 | 2,430.06 | 38.8 |
| Halifax | 403,131 | 390,096 | 3.3 | 5,490.35 | 73.4 |
| Queens | 10,307 | 10,917 | -5.6 | 2,392.63 | 4.3 |
| Total regional municipalities | 507,723 | 498,411 | 1.0 | 10,313.04 | 49.2 |
Towns
Nova Scotia has 26 towns, not including the former Town of Canso that dissolved to become part of Guysborough County on July 1, 2012 and the former Towns of Bridgetown and Springhill which dissolved on April 1, 2015.
Population centres
The Halifax population centre is the largest urban area in Nova Scotia. Statistics Canada recognizes a total of 37 population centres in the province.
The below table is a list of those population centres in Nova Scotia from the 2021 Census of Population as designated, named, and delineated by Statistics Canada.
| Population centres of Nova Scotia |
|---|
| Rank | Population centre | Size group | Population (2021) | Population (2016) | Change | Land area (km2) | Population density |
|---|---|---|---|---|---|---|---|
| 1 | Halifax | Large urban | 348,634 | 317,334 | +9.9% | 238.29 | 1,463.1/km2 |
| 2 | Cape Breton - Sydney | Medium | 30,960 | 30,170 | +2.6% | 30.91 | 1,001.6/km2 |
| 3 | Truro | Small | 23,583 | 23,205 | +1.6% | 31.52 | 748.2/km2 |
| 4 | New Glasgow | Small | 19,316 | 19,137 | +0.9% | 29.82 | 647.8/km2 |
| 5 | Glace Bay | Small | 16,915 | 17,604 | −3.9% | 31.19 | 542.3/km2 |
| 6 | Kentville | Small | 14,905 | 14,449 | +3.2% | 27.98 | 532.7/km2 |
| 7 | Sydney Mines | Small | 12,353 | 12,823 | −3.7% | 18.11 | 682.1/km2 |
| 8 | Amherst | Small | 9,548 | 9,550 | 0.0% | 12.38 | 771.2/km2 |
| 9 | Bridgewater | Small | 8,790 | 8,532 | +3.0% | 13.63 | 644.9/km2 |
| 10 | Yarmouth | Small | 7,848 | 7,527 | +4.3% | 16.81 | 466.9/km2 |
| 11 | Kingston - Greenwood | Small | 7,118 | 6,879 | +3.5% | 17.22 | 413.4/km2 |
| 12 | New Waterford | Small | 6,723 | 7,416 | −9.3% | 9.23 | 728.4/km2 |
| 13 | Enfield - Lantz | Small | 6,583 | 6,807 | −3.3% | 11.67 | 564.1/km2 |
| 14 | Antigonish | Small | 5,620 | 5,079 | +10.7% | 5.88 | 955.8/km2 |
| 15 | Windsor | Small | 5,514 | 5,248 | +5.1% | 10.56 | 522.2/km2 |
| 16 | Wolfville | Small | 5,057 | 4,195 | +20.5% | 6.46 | 782.8/km2 |
| 17 | Still Water Lake | Small | 3,379 | 3,447 | −2.0% | 8.23 | 410.6/km2 |
| 18 | Port Hawkesbury | Small | 2,998 | 3,004 | −0.2% | 5 | 599.6/km2 |
| 19 | Springhill | Small | 2,654 | 2,743 | −3.2% | 4.84 | 548.3/km2 |
| 20 | Pictou | Small | 2,643 | 2,711 | −2.5% | 4.35 | 607.6/km2 |
| 21 | Eskasoni 3 | Small | 2,575 | 2,352 | +9.5% | 5.7 | 451.8/km2 |
| 22 | Liverpool | Small | 2,546 | 2,549 | −0.1% | 3.59 | 709.2/km2 |
| 23 | Berwick | Small | 2,455 | 2,517 | −2.5% | 4.31 | 569.6/km2 |
| 24 | Lunenburg | Small | 2,405 | 2,262 | +6.3% | 3.35 | 717.9/km2 |
| 25 | Lake Echo | Small | 2,365 | 2,515 | −6.0% | 4.76 | 496.8/km2 |
| 26 | Indian Brook 14 | Small | 2,332 | 655 | +256.0% | 3.89 | 599.5/km2 |
| 27 | Digby | Small | 2,001 | 2,060 | −2.9% | 3.16 | 633.2/km2 |
| 28 | Hantsport | Small | 1,542 | 1,560 | −1.2% | 2.89 | 533.6/km2 |
| 29 | Brookside | Small | 1,439 | 1,441 | −0.1% | 2.81 | 512.1/km2 |
| 30 | Shelburne | Small | 1,439 | 1,483 | −3.0% | 2.6 | 553.5/km2 |
| 31 | Middleton | Small | 1,429 | 1,391 | +2.7% | 2.72 | 525.4/km2 |
| 32 | Chester | Small | 1,371 | 1,362 | +0.7% | 3.23 | 424.5/km2 |
| 33 | Inverness | Small | 1,228 | 1,248 | −1.6% | 2.73 | 449.8/km2 |
| 34 | Centreville | Small | 1,159 | 1,129 | +2.7% | 2.36 | 491.1/km2 |
| 35 | Howie Centre | Small | 1,106 | 1,157 | −4.4% | 1.67 | 662.3/km2 |
| 36 | Hayes Subdivision | Small | 1,044 | 1,121 | −6.9% | 1.1 | 949.1/km2 |
| 37 | Port Williams | Small | 1,030 | 1,120 | −8.0% | 1.92 | 536.5/km2 |
Population of Nova Scotia since 1851
|
|
||||||||||||||||||||||||||||||||||||||||||||||||||||||||||||||||||||||||||||||||||||||||||||||||||||||||||||||||||
Source: Statistics Canada
* among provinces.
** Preliminary 2006 census estimate.
Visible minorities and Aboriginals
| Visible minority and Aboriginal population (Canada 2011 Census) | |||
|---|---|---|---|
| Population group | Population | % of total population | |
| White | 825,050 | 91% | |
| Visible minority group Source: |
South Asian | 4,965 | 0.5% |
| Chinese | 6,050 | 0.7% | |
| Black | 20,790 | 2.3% | |
| Latin American | 1,360 | 0.2% | |
| Filipino | 1,890 | 0.2% | |
| Arab | 6,290 | 0.7% | |
| Southeast Asian | 1,155 | 0.1% | |
| West Asian | 1,365 | 0.2% | |
| Korean | 960 | 0.1% | |
| Japanese | 445 | 0% | |
| Visible minority, n.i.e. | 720 | 0.1% | |
| Multiple visible minority | 1,290 | 0.1% | |
| Total visible minority population | 47,270 | 5.2% | |
| Aboriginal group Source: |
First Nations | 21,895 | 2.4% |
| Métis | 10,050 | 1.1% | |
| Inuit | 695 | 0.1% | |
| Multiple Aboriginal identity | 225 | 0% | |
| Aboriginal, n.i.e. | 980 | 0.1% | |
| Total Aboriginal population | 33,850 | 3.7% | |
| Total population | 906,175 | 100% | |
Languages

The 2011 Canadian census showed a population of 921,727.
Of the 904,285 singular responses to the census question concerning mother tongue the most commonly reported languages were:
| Ranking | Language | Population | Percentage |
|---|---|---|---|
| 1. | English | 836,085 | 92.46% |
| 2. | French | 31,105 | 3.44% |
| 3. | Arabic | 5,965 | 0.66% |
| 4. | Algonquian languages | 4,685 | 0.52% |
| Mi'kmaq | 4,620 | 0.51% | |
| 5. | German | 3,275 | 0.36% |
| 6. | Chinese | 2,750 | 0.30% |
| Mandarin | 905 | 0.10% | |
| Cantonese | 590 | 0.06% | |
| 7. | Dutch | 1,725 | 0.19% |
| 8. | Spanish | 1,545 | 0.17% |
| =9. | Tagalog | 1,185 | 0.13% |
| =9. | Persian | 1,185 | 0.13% |
| 11. | Polish | 825 | 0.09% |
| =12. | Korean | 815 | 0.09% |
| =12. | Russian | 815 | 0.09% |
| 14. | Italian | 790 | 0.09% |
| 15. | Greek | 775 | 0.08% |
| 16. | Scandinavian languages | 595 | 0.06% |
| Danish | 175 | 0.02% | |
| Norwegian | 125 | 0.02% | |
| Icelandic | 120 | 0.01% | |
| Swedish | 85 | 0.01% | |
| 17. | Urdu | 540 | 0.06% |
| 18. | Serbo-Croatian languages | 520 | 0.06% |
| Croatian | 210 | 0.02% | |
| Serbo-Croatian | 105 | 0.01% | |
| Bosnian | 90 | 0.01% | |
| Serbian | 115 | 0.01% | |
| 19. | Hindi | 515 | 0.06% |
| 20. | Vietnamese | 450 | 0.05% |
| 21. | Portuguese | 380 | 0.04% |
| 22. | Bengali | 375 | 0.04% |
| 23. | Panjabi | 370 | 0.04% |
| 24. | Celtic languages | 330 | 0.04% |
| 25. | Japanese | 305 | 0.03% |
| 26. | Ukrainian | 300 | 0.03% |
| 27. | Hungarian | 280 | 0.03% |
| 28. | Czech | 180 | 0.02% |
| 29. | Romanian | 170 | 0.02% |
| 30. | Gujarati | 105 | 0.01% |
There were also 275 single-language responses for Turkish; 195 for Non-verbal languages (Sign languages); 30 for Malay; 100 for Bantu languages; 70 for Kurdish; 120 for Slovak; and 5 for Estonian. Figures shown are for the number of single language responses and the percentage of total single-language responses.
Migration
Immigration
The 2006 Canadian census counted a total of 45,195 immigrants living in Nova Scotia.
The most commonly reported origins for these immigrants were:
| Country | Immigrants | |
|---|---|---|
| 1. | United Kingdom | 11,665 |
| 2. | United States | 7,960 |
| 3. | Germany | 2,850 |
| 4. | Netherlands | 1,830 |
| 5. | China | 1,740 |
| 6. | India | 1,440 |
| 7. | Lebanon | 1,265 |
| 8. | Poland | 970 |
| 9. | Kuwait | 780 |
| 10. | Egypt | 675 |
| 11. | former Yugoslavia | 670 |
| 12. | Greece | 545 |
| 13. | Italy | 540 |
| 14. | France | 530 |
| 15. | Iran | 520 |
| 16. | Pakistan | 450 |
| 17. | South Korea | 430 |
| 18. | Ireland (Éire) | 425 |
| 19. | Philippines | 420 |
| 20. | Vietnam | 375 |
There were also 365 immigrants from Australia; 320 from South Africa; 280 from Hong Kong; 255 from Saudi Arabia; 245 from Iraq and from Trinidad and Tobago; 225 from Hungary and from Russia; 220 from Portugal; 215 from Switzerland; 210 from Denmark; and 205 from Belize.
Internal migration

A total of 101,035 people moved to Nova Scotia from other parts of Canada between 1996 and 2006 while 110,335 people moved in the opposite direction. These movements resulted in a net outmigration of 11,925 people to Alberta and 4,120 to Ontario; as well as a net influx of 4,690 people from Newfoundland and Labrador and 2,930 from New Brunswick. During this period there was a net outmigration of 835 francophones to Quebec and 340 to Alberta; and a net influx of 575 anglophones from Quebec and 145 francophones from New Brunswick. (All net inter-provincial movements of more than 500 persons and official minority movements of more than 100 persons are given.)
Religion

| Religion | Population | Pct (%) |
|---|---|---|
| Catholic | 298,270 | 32.92% |
| No religious affiliation | 197,665 | 21.81% |
| United Church | 109,700 | 12.10% |
| Anglican | 100,120 | 11.05% |
| Baptist | 80,815 | 8.92% |
| Other Christian | 55,555 | 6.13% |
| Presbyterian | 23,555 | 2.60% |
| Pentecostal | 9,595 | 1.06% |
| Lutheran | 9,485 | 1.05% |
| Muslim | 8,505 | 0.94% |
| Christian Orthodox | 3,370 | 0.37% |
| Other religions | 2,720 | 0.30% |
| Buddhist | 2,205 | 0.24% |
| Hindu | 1,850 | 0.20% |
| Jewish | 1,805 | 0.20% |
| Traditional (Aboriginal) Spirituality | 570 | 0.06% |
| Sikh | 390 | 0.04% |
Employment
As of February 2019, the unemployment rate for the province is 6.4 percent. Halifax Regional Municipality 4.9 percent
Income
| By County | By Community | |||||||||||||||||||||||||||||||||||||||||||||||||||||||||||||||||||||||||||||||||||||||||||||||||||||||||||||||||||||||||||||||||||||||||||||||||||||||||||||||||||||
|---|---|---|---|---|---|---|---|---|---|---|---|---|---|---|---|---|---|---|---|---|---|---|---|---|---|---|---|---|---|---|---|---|---|---|---|---|---|---|---|---|---|---|---|---|---|---|---|---|---|---|---|---|---|---|---|---|---|---|---|---|---|---|---|---|---|---|---|---|---|---|---|---|---|---|---|---|---|---|---|---|---|---|---|---|---|---|---|---|---|---|---|---|---|---|---|---|---|---|---|---|---|---|---|---|---|---|---|---|---|---|---|---|---|---|---|---|---|---|---|---|---|---|---|---|---|---|---|---|---|---|---|---|---|---|---|---|---|---|---|---|---|---|---|---|---|---|---|---|---|---|---|---|---|---|---|---|---|---|---|---|---|---|---|---|---|---|
|
|
|
Gross domestic product
Nova Scotia GDP is presently approximately $33 billion (Can) annually.
Images for kids
-
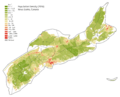
Canada Nova Scotia Density 2016
-
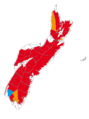
Mother tongue in Nova Scotia: Red – majority anglophone, Orange – mixed, Blue – majority francophone.

See also
 In Spanish: Demografía de Nueva Escocia para niños
