Critical path drag facts for kids
Have you ever worked on a big school project, like building a model volcano or creating a group presentation? Some steps have to be done in a specific order. For example, you can't paint the volcano before you've built its shape! The longest chain of steps that you must do one after another is called the critical path. If any step on this path gets delayed, your whole project gets delayed.
Critical path drag is a special measurement developed by Stephen Devaux for project management. It tells you exactly how much time a single task on the critical path is adding to the project's total length. Think of it as a "drag" on your project's timeline, like an anchor slowing down a boat. By finding the tasks with the most drag, project managers can figure out the best way to speed things up.
Contents
What is a Project's Critical Path?
Every project, from building a skyscraper to planning a party, is made up of many smaller tasks. The critical path is the sequence of tasks that determines the shortest possible time to complete the entire project.
- Dependent Tasks: These are tasks that can't start until a previous one is finished. You must bake a cake before you can put icing on it.
- The Longest Chain: The critical path is the longest chain of these dependent tasks.
- No Wiggle Room: Tasks on the critical path have zero "float" (extra time). Any delay in these tasks will push back the project's finish date.
Other tasks that are not on the critical path have float. This means they can be delayed a little bit without affecting the project's deadline.
Understanding Critical Path Drag
While the critical path tells you which tasks are most important for the schedule, critical path drag tells you how much each of those tasks is delaying the project. It helps managers pinpoint the exact sources of delay.
How is Drag Calculated?
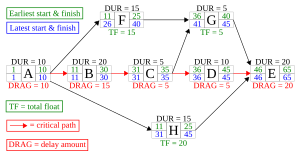
Let's look at the diagram to understand how drag works. The critical path is made of tasks A, B, C, D, and E. The other tasks (F, G, and H) can be worked on at the same time as some of the critical tasks.
- Tasks with Nothing in Parallel: Look at Task A (10 days) and Task E (20 days). No other tasks are happening at the same time. This means their entire duration is "dragging" the project. So, the drag of Task A is 10 days, and the drag of Task E is 20 days.
- Tasks with Parallel Activities:
- Task B takes 20 days. At the same time, Task F is happening. Task F has a "float" (extra time) of 15 days. This means we can only shorten Task B by 15 days before Task F becomes the new problem. Therefore, Task B's drag is 15 days.
- Task C only takes 5 days. Even though it's also parallel to Task F (with 15 days of float), you can't shorten a task by more than its own length. So, Task C's drag is only 5 days.
- Task D takes 10 days and is parallel to Task G (which has 5 days of float). The drag of Task D is limited by Task G's float, so its drag is 5 days.
In simple terms, the drag of a critical path task is the smaller of two numbers: its own duration, or the float of the parallel task with the least amount of float.
What About More Complicated Projects?
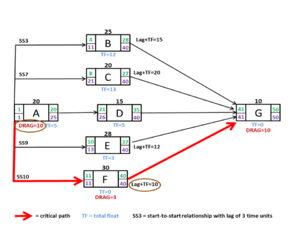
Not all projects have simple "finish-one-task-then-start-the-next" relationships. Sometimes, tasks can overlap. For example, you might be able to start painting a long fence just a few days after your friend starts building it. This is called a "start-to-start" (SS) relationship.
In these more complex schedules, calculating drag can be difficult. Special software is often used to figure it out. However, the goal is always the same: to find out which part of a task is causing the biggest delay to the project's finish date.
Why is Drag Important in Real Life?
Knowing the critical path drag helps project managers make smart decisions. It's not just about time; it's often about money.
Finding the "Drag Cost"
In big projects, every day of delay can be very expensive. The drag cost of an activity is the total cost of the delay it is causing.
For example, imagine every day the project in the first diagram is delayed costs the company $10,000.
- Task E has a drag of 20 days. Its drag cost is 20 x $10,000 = $200,000.
- Task B has a drag of 15 days. Its drag cost is 15 x $10,000 = $150,000.
- Tasks C and D both have a drag of 5 days. Their drag cost is 5 x $10,000 = $50,000 each.
Making Smart Choices
By knowing the drag cost, a project manager can decide where to spend extra money to speed things up.
Let's say they could hire more workers for $50,000 to cut the time for Task B in half (from 20 days to 10 days). This would reduce Task B's drag and save the project a lot of money in delay costs. Calculating drag helps managers focus their resources on the tasks that will make the biggest difference.


