
Curve fitting facts for kids

Curve fitting is like drawing a smooth line or curve that best matches a bunch of data points you have. Imagine you've measured something many times and plotted the results on a graph. Curve fitting helps you find a mathematical rule (a function) that describes the pattern of those points.
This process helps us understand the data better. It can also help us guess what might happen next or what values might be in between our measurements.
Contents
What is Curve Fitting?
Curve fitting is a way to find a mathematical function that closely follows a set of data points. Think of it as finding the best line or curve that goes through or near your plotted points. This function can then represent the relationship between different things you are measuring.
For example, if you track how a plant grows taller each week, you could use curve fitting. It would help you find a curve that shows the plant's growth pattern over time.
Why Do We Use Curve Fitting?
We use curve fitting for several important reasons:
- Seeing the Big Picture: It helps us visualize data. A smooth curve makes it easier to see trends and patterns than just looking at many scattered points.
- Making Predictions: Once you have a fitted curve, you can use it to guess values where you don't have data. This is useful for predicting future outcomes or estimating missing information.
- Summarizing Information: A fitted curve can sum up the relationship between two or more things. Instead of a long list of numbers, you get a simple mathematical rule.
Types of Curve Fitting
There are two main ways to fit a curve to data:
Interpolation
When you use interpolation, the curve you create must pass exactly through every single data point. It's like connecting the dots perfectly. This is useful when you know your data points are very accurate and you want to find values *between* them.
Smoothing
Smoothing is different. Here, the curve doesn't have to hit every single point exactly. Instead, it tries to create a "smooth" line that generally follows the trend of the data. This is helpful when your data might have some errors or "noise." The smooth curve helps to show the true pattern without being distracted by small mistakes in the measurements.
A related idea is regression analysis. This is a type of smoothing. It helps us understand how much uncertainty there is in the curve we fit. It also helps us see how strong the relationship is between the things we are measuring.
What is Extrapolation?
Extrapolation means using your fitted curve to guess values *outside* the range of your original data. For example, if you fitted a curve to plant growth for 10 weeks, extrapolation would be using that curve to guess the plant's height in week 12.
Extrapolation can be tricky. The further you go beyond your original data, the less certain your guesses become. The curve might not follow the same pattern outside the measured range.
Images for kids
-
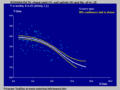
Relation between wheat yield and soil salinity
-

different models of ellipse fitting


See also
 In Spanish: Ajuste de curvas para niños
