Electroencephalography facts for kids

Imagine your brain is like a super busy city, always sending messages! Electroencephalography, or EEG for short, is a cool way to listen in on those messages. Your brain cells, called neurons, talk to each other using tiny electrical signals. EEG records these electrical patterns from the skin on your head.
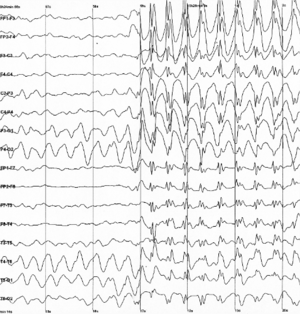
Doctors use EEG to check how well your brain is working, especially if they think there might be a problem with your nerves. The recording itself is called an electroencephalogram, but most people just say EEG for both the test and the result. EEG helps doctors find out about things like epilepsy (a condition that causes seizures), how deep someone is sleeping, or if someone is in a coma. It can even help understand different sleep phases and rhythms.
Contents
Understanding Brain Waves
Scientists study EEG recordings by looking at different "waves" in the signal. These waves don't move across your body like ocean waves. Instead, they show how the electrical signals in one part of your brain change over time. Scientists use special math to separate these signals into different speeds, or frequencies. Each speed tells us something different about what your brain is doing.
Delta Waves
These are the slowest waves, moving at about 1 to 4 cycles per second. You mostly see delta waves when a person is in a deep sleep or under anesthesia.
Theta Waves
Theta waves are a bit faster, from 4 to 8 cycles per second. You might see these waves when someone is trying to remember many things, like numbers or words. They also show up when a person is feeling sleepy or drowsy.
Alpha Waves
Next are alpha waves, which happen at 8 to 12 cycles per second. These waves are often seen at the back of your head when your eyes are closed. They also appear when you are resting quietly or meditating.
Beta Waves
Beta waves are faster than alpha, ranging from 12 to 30 cycles per second. Your brain produces beta waves when you are getting ready to move, or when you are actively thinking and not resting. They can also be seen when someone takes certain medicines called benzodiazepine drugs.
Gamma Waves
Gamma waves are the fastest waves found in EEG, from 30 to 100 cycles per second. These waves are active when you are really concentrating, thinking hard, or paying close attention to something.
Images for kids
-
The first human EEG recording obtained by Hans Berger in 1924. The upper tracing is EEG, and the lower is a 10 Hz timing signal.
-
Human EEG with prominent resting state activity – alpha-rhythm. Left: EEG traces (horizontal – time in seconds; vertical – amplitudes, scale 100 μV). Right: power spectra of shown signals (vertical lines – 10 and 20 Hz, scale is linear). Alpha-rhythm consists of sinusoidal-like waves with frequencies in 8–12 Hz range (11 Hz in this case) more prominent in posterior sites. Alpha range is red at power spectrum graph.
-
Human EEG with in resting state. Left: EEG traces (horizontal – time in seconds; vertical – amplitudes, scale 100 μV). Right: power spectra of shown signals (vertical lines – 10 and 20 Hz, scale is linear). 80–90% of people have prominent sinusoidal-like waves with frequencies in 8–12 Hz range – alpha rhythm. Others (like this) lack this type of activity.
-
Common artifacts in human EEG. 1: Electrooculographic artifact caused by the excitation of eyeball's muscles (related to blinking, for example). Big-amplitude, slow, positive wave prominent in frontal electrodes. 2: Electrode's artifact caused by bad contact (and thus bigger impedance) between P3 electrode and skin. 3: Swallowing artifact. 4: Common reference electrode's artifact caused by bad contact between reference electrode and skin. Huge wave similar in all channels.
See also
 In Spanish: Electroencefalografía para niños
 | William L. Dawson |
 | W. E. B. Du Bois |
 | Harry Belafonte |


