
Image: 1776 Historical energy consumption - U.S. - EIA data

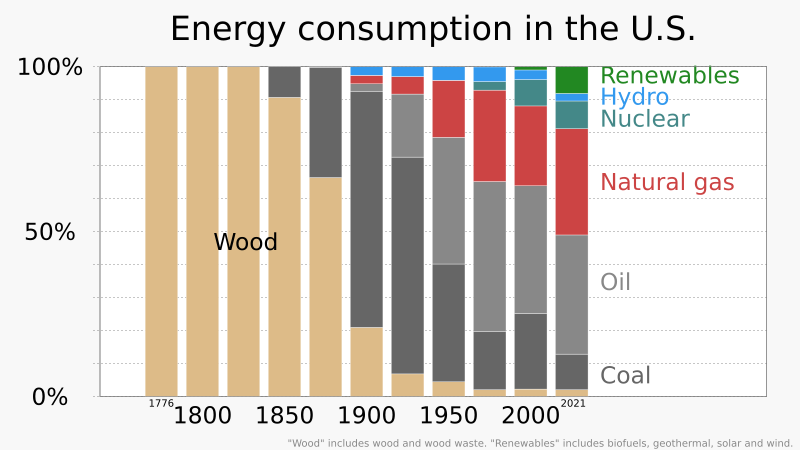
Description: Stacked bar chart (stacked column chart) showing historical consumption of energy in the United States, distinguished by energy source Data source: Renewable energy explained. eia.gov. U.S. Energy Information Administration (April 2022). Archived from the original on 13 March 2023. "Data source: U.S. Energy Information Administration, Monthly Energy Review, Appendix D.1, and Tables 1.3 an 10.1, April 2022, preliminary data for 2021. / Wood includes wood and wood waste; Renewables includes biofuels, geothermal, solar and wind." Most SVG code was automatically generated by the "Vertical bar charts" spreadsheeet linked at User:RCraig09/Excel to XML for SVG. Text was added manually in a text editor. This SVG file contains embedded text that can be translated into your language, using any capable SVG editor, text editor or the SVG Translate tool. For more information see: About translating SVG files.
Title: 1776 Historical energy consumption - U.S. - EIA data
Credit: Own work
Author: RCraig09
Usage Terms: Creative Commons Attribution-Share Alike 4.0
License: CC BY-SA 4.0
License Link: https://creativecommons.org/licenses/by-sa/4.0
Attribution Required?: Yes
Image usage
The following page links to this image:
