
Image: 1900 NYC Density Map
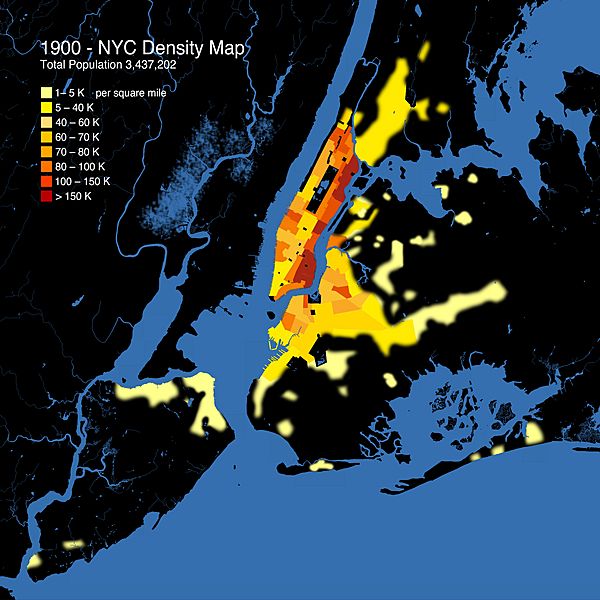
Description: The density map for 1900 is derived from combining publicly available map data with statistics from the NYC census that year. The census lists the population and racial characteristics of each electoral district or city ward. Meanwhile, the city maps illustrate the boundaries of each ward. In mapping software (Google My Maps) the boundaries of each ward were drawn, the surface area of each determined, and then the density calculated and assigned a color on a sliding scale from 1,000 to > 150,000.
Title: 1900 NYC Density Map
Credit: Own work
Author: Myles Zhang
Usage Terms: Creative Commons Attribution-Share Alike 4.0
License: CC BY-SA 4.0
License Link: https://creativecommons.org/licenses/by-sa/4.0
Attribution Required?: Yes
Image usage
The following page links to this image:
