
Demographic history of New York City facts for kids
New York City has a long and interesting history of different groups of people living there. It started when Native American residents sold the land to the Dutch. Over time, it grew into the diverse city we know today.
For a long time, most people in New York City were white. Before World War II, most immigrants came from Europe. But after the war, things changed a lot. More people from all over the world began to move to the city. This was especially true after a new law in 1965 made it easier for people from non-European countries to immigrate.
Contents
New York City's Changing Population
Until after World War II, over 90% of New York City's population was non-Hispanic white. Large numbers of non-white people only started moving to Manhattan in the 1920s. They began settling in other parts of the city after World War II. Staten Island was the slowest borough to change. It kept a non-Hispanic white majority even after the 1980s.
Between 1900 and 2010, the number of Black people in New York City grew by about 35 times. The Asian population grew even more, by over 150 times. Many Black Americans moved to New York City during the Great Migration. This led to the Harlem Renaissance, a time of rich cultural growth for African Americans in the city, especially in the Harlem neighborhood.
New York's Hispanic population also grew a lot, by almost 20 times between 1940 and 2010. During the same period, the total non-Hispanic white population decreased by over 60%.
Each of New York City's five boroughs has a unique history of settlement. The Bronx and Brooklyn were popular places for Black people to settle. Queens became a top choice for Asian immigrants. The Bronx was also a favorite spot for Hispanic immigrants.
New York City's total population more than doubled from 1900 to 2010. The Bronx, Queens, and Staten Island saw huge population increases. Brooklyn grew more slowly. Manhattan actually had fewer people in 2010 than in 1900.
Immigrants in New York
New York City has always had a much higher percentage of immigrants than the rest of the United States. Before World War I, over 40% of the city's population were immigrants. After new immigration laws in the 1920s, this number dropped to 18% by 1970. But it rose again to 36% by 2000. This increase happened after the Immigration and Nationality Act of 1965 made it easier for more immigrants to come to the U.S.
Most early immigrants to New York City came from Europe. First, they came from Western Europe, then more from Eastern Europe. Many Irish people arrived in the 1840s during the Great Famine. Germans, Italians, Jews, and other European groups came mostly in the late 1800s and early 1900s.
After 1965, a large number of immigrants came from countries outside Europe. About three million immigrants live in New York City today. The number of foreign-born residents grew slightly from 2000 to 2011.
Citywide Population Changes
Here's a look at how the different groups in New York City have changed over the years. This table includes all five boroughs.
| Year | Population | White (includes White Hispanics) |
% W |
Non-Hispanic Whites | % ANG |
Black | % B |
Asian | % A |
Other or Mixed |
% O/M |
Hispanic/ Latino |
% H/L |
Foreign born |
% FB |
|---|---|---|---|---|---|---|---|---|---|---|---|---|---|---|---|
| 1900 | 3,437,202 | 3,369,898 | 98.04 | N/A | N/A | 60,666 | 1.76 | 6,607 | 0.19 | 31 | 0 | N/A | N/A | 1,270,080 | 36.95 |
| 1910 | 4,766,883 | 4,669,162 | 97.95 | N/A | N/A | 91,709 | 1.92 | 5,669 | 0.12 | 343 | 0.01 | N/A | N/A | 1,944,357 | 40.79 |
| 1920 | 5,620,048 | 5,459,463 | 97.14 | N/A | N/A | 152,467 | 2.71 | 7,969 | 0.14 | 149 | 0 | N/A | N/A | 2,028,160 | 36.09 |
| 1930 | 6,930,446 | 6,589,377 | 95.08 | N/A | N/A | 327,706 | 4.73 | 12,972 | 0.19 | 391 | 0.01 | N/A | N/A | 2,358,686 | 34.03 |
| 1940 | 7,454,995 | 6,977,501 | 93.59 | 6,856,586 | 91.97 | 458,444 | 6.15 | 17,986 | 0.24 | 1,064 | 0.01 | 120,915 | 1.62 | 2,138,657 | 28.69 |
| 1950 | 7,891,957 | 7,116,441 | 90.17 | N/A | N/A | 747,608 | 9.47 | 21,441 | 0.27 | 6,467 | 0.08 | N/A | N/A | 1,784,206 | 22.61 |
| 1960 | 7,781,984 | 6,640,662 | 85.33 | N/A | N/A | 1,087,931 | 13.98 | 43,103 | 0.55 | 10,288 | 0.13 | N/A | N/A | 1,558,690 | 20.03 |
| 1970 | 7,894,862 | 6,048,841 | 76.62 | 4,969,749 | 62.95 | 1,668,115 | 21.13 | 94,499 | 1.20 | 83,407 | 1.06 | 1,278,630 | 16.20 | 1,437,058 | 18.20 |
| 1980 | 7,071,639 | 4,294,075 | 60.72 | 3,668,945 | 51.88 | 1,784,337 | 25.23 | 231,501 | 3.27 | 761,762 | 10.77 | 1,406,024 | 19.88 | 1,670,199 | 23.62 |
| 1990 | 7,322,564 | 3,827,088 | 52.26 | 3,163,125 | 43.20 | 2,102,512 | 28.71 | 512,719 | 7.00 | 880,245 | 12.02 | 1,783,511 | 24.36 | 2,082,931 | 28.45 |
| 2000 | 8,008,278 | 3,576,385 | 44.66 | 2,801,267 | 34.98 | 2,129,762 | 26.59 | 792,477 | 9.90 | 1,509,654 | 18.85 | 2,160,554 | 26.98 | 2,871,032 | 35.85 |
| 2010 | 8,175,133 | 3,597,341 | 44.00 | 2,722,904 | 33.31 | 2,088,510 | 25.55 | 1,043,535 | 12.77 | 1,445,747 | 17.68 | 2,336,076 | 28.58 | 3,066,599 | 37.51 |
| 2020 | 8,804,190 | 3,000,945 | 34.09 | 2,719,856 | 30.89 | 1,943,645 | 22.08 | 1,385,144 | 15.73 | 2,474,456 | 28.11 | 2,490,350 | 28.29 | N/A | N/A |
Population by Borough
The Bronx
The Bronx saw huge population growth between 1900 and 2010. It was a very popular place for Hispanic and Black migrants to settle.
-
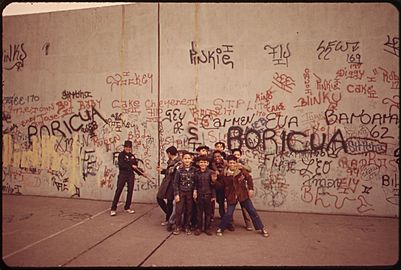
Children playing on a sidewalk in 1973
-
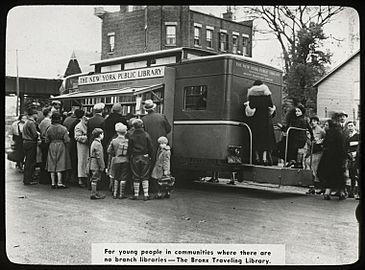
A traveling public library in 1938
-
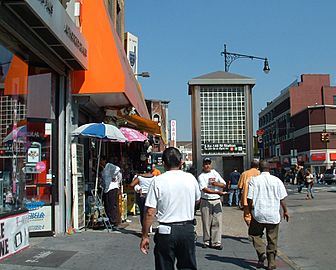
The Hub in 2007

.jpg)

| Year | Population | White (includes White Hispanics) |
% W |
Non-Hispanic Whites | % ANG |
Black | % B |
Asian | % A |
Other or Mixed |
% O/M |
Hispanic/ Latino |
% H/L |
Foreign born |
% FB |
|---|---|---|---|---|---|---|---|---|---|---|---|---|---|---|---|
| 1900 | 200,507 | 197,923 | 98.71 | N/A | N/A | 2,370 | 1.18 | 208 | 0.10 | 6 | 0 | N/A | N/A | 61,258 | 30.55 |
| 1910 | 430,980 | 426,650 | 99.00 | N/A | N/A | 4,117 | 0.96 | 189 | 0.04 | 24 | 0.01 | N/A | N/A | 149,427 | 34.67 |
| 1920 | 732,016 | 726,990 | 99.31 | N/A | N/A | 4,803 | 0.66 | 215 | 0.03 | 8 | 0 | N/A | N/A | 267,742 | 36.58 |
| 1930 | 1,265,258 | 1,251,823 | 98.94 | N/A | N/A | 12,930 | 1.02 | 476 | 0.04 | 29 | 0 | N/A | N/A | 479,451 | 37.89 |
| 1940 | 1,394,711 | 1,370,319 | 98.25 | N/A | N/A | 23,529 | 1.69 | 801 | 0.06 | 62 | 0 | N/A | N/A | 463,453 | 33.23 |
| 1950 | 1,451,277 | 1,351,662 | 93.14 | N/A | N/A | 97,752 | 6.74 | 1,249 | 0.09 | 614 | 0.04 | N/A | N/A | 373,894 | 25.76 |
| 1960 | 1,424,815 | 1,256,284 | 88.17 | N/A | N/A | 163,896 | 11.50 | 3,544 | 0.25 | 1,091 | 0.08 | N/A | N/A | 306,592 | 21.52 |
| 1970 | 1,471,701 | 1,080,859 | 73.44 | N/A | N/A | 357,681 | 24.30 | 7,792 | 0.53 | 25,369 | 1.72 | N/A | N/A | 229,210 | 15.57 |
| 1980 | 1,168,972 | 554,046 | 47.40 | 396,836 | 33.95 | 371,926 | 31.82 | 15,163 | 1.30 | 227,837 | 19.49 | 396,353 | 33.91 | 215,313 | 18.42 |
| 1990 | 1,203,789 | 430,077 | 35.73 | 272,503 | 22.64 | 449,399 | 37.33 | 35,562 | 2.95 | 288,751 | 23.99 | 523,111 | 43.46 | 274,793 | 22.83 |
| 2000 | 1,332,650 | 398,003 | 29.87 | 193,651 | 14.53 | 475,007 | 35.64 | 41,503 | 3.11 | 418,137 | 31.38 | 644,705 | 48.38 | 385,827 | 28.95 |
| 2010 | 1,385,108 | 386,497 | 27.90 | 151,209 | 10.92 | 505,200 | 36.47 | 50,897 | 3.68 | 442,514 | 31.95 | 741,413 | 53.53 | 518,353 | 37.42 |
| 2021 | 1,435,070 | 657,262 | 45.80 | 131,140 | 9.14 | 617,080 | 43.00 | 57,402 | 4.00 | 43,052 | 3.00 | 774,937 | 54.00 | 489,358 | 31.00 |
Brooklyn
Brooklyn's population grew at a slower rate than other boroughs between 1900 and 2010. It was also a popular destination for Black people moving to New York City.
-
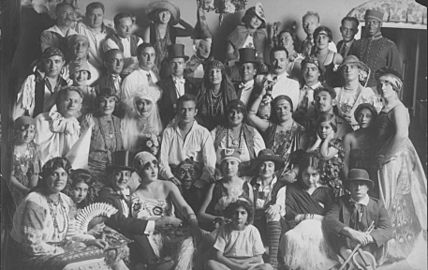
Purim party around 1925
-
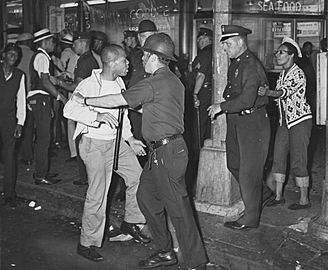
A scene in Bedford-Stuyvesant, 1964
-

Poetry reading in Bushwick
.jpg)

.jpg)
| Year | Population | White (includes White Hispanics) |
% W |
Non-Hispanic Whites | % ANG |
Black | % B |
Asian | % A |
Other or Mixed |
% O/M |
Hispanic/ Latino |
% H/L |
Foreign born |
% FB |
|---|---|---|---|---|---|---|---|---|---|---|---|---|---|---|---|
| 1900 | 1,166,582 | 1,146,909 | 98.31 | N/A | N/A | 18,367 | 1.57 | 1,300 | 0.11 | 6 | 0 | N/A | N/A | 355,697 | 30.49 |
| 1910 | 1,634,351 | 1,610,487 | 98.54 | N/A | N/A | 22,708 | 1.39 | 1,010 | 0.06 | 146 | 0.01 | N/A | N/A | 574,730 | 35.17 |
| 1920 | 2,018,356 | 1,984,953 | 98.35 | N/A | N/A | 31,912 | 1.58 | 1,459 | 0.07 | 32 | 0 | N/A | N/A | 666,188 | 33.01 |
| 1930 | 2,560,401 | 2,488,815 | 97.20 | N/A | N/A | 68,921 | 2.69 | 2,539 | 0.10 | 126 | 0 | N/A | N/A | 881,571 | 34.43 |
| 1940 | 2,698,285 | 2,587,951 | 95.91 | N/A | N/A | 107,263 | 3.98 | 2,608 | 0.10 | 463 | 0.02 | N/A | N/A | 778,054 | 28.84 |
| 1950 | 2,738,175 | 2,525,118 | 92.22 | N/A | N/A | 208,478 | 7.61 | 2,514 | 0.09 | 2,065 | 0.08 | N/A | N/A | 630,526 | 23.03 |
| 1960 | 2,627,319 | 2,245,859 | 85.48 | N/A | N/A | 371,405 | 14.14 | 6,540 | 0.25 | 3,515 | 0.13 | N/A | N/A | 516,349 | 19.65 |
| 1970 | 2,602,012 | 1,905,788 | 73.24 | N/A | N/A | 656,194 | 25.22 | 16,138 | 0.62 | 23,892 | 0.92 | N/A | N/A | 456,636 | 17.55 |
| 1980 | 2,230,936 | 1,249,486 | 56.01 | 1,085,233 | 48.64 | 722,812 | 32.40 | 42,965 | 1.93 | 215,673 | 9.67 | 392,118 | 17.58 | 530,973 | 23.80 |
| 1990 | 2,300,664 | 1,078,549 | 46.88 | 923,229 | 40.13 | 872,305 | 37.92 | 111,251 | 4.84 | 238,559 | 10.37 | 462,411 | 20.10 | 672,569 | 29.23 |
| 2000 | 2,465,326 | 1,015,728 | 41.20 | 854,532 | 34.66 | 898,350 | 36.44 | 187,283 | 7.60 | 363,965 | 14.76 | 487,878 | 19.79 | 931,769 | 37.79 |
| 2010 | 2,504,700 | 1,072,041 | 42.80 | 893,306 | 35.67 | 860,083 | 34.34 | 263,519 | 10.52 | 309,057 | 12.34 | 496,285 | 19.81 | 912,793 | 36.44 |
Manhattan
Manhattan had fewer people in 2010 than in 1900. It also saw a significant increase in its Black population in the early 1900s.
-
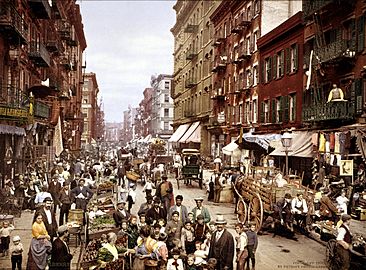
Little Italy in Manhattan around 1900
-
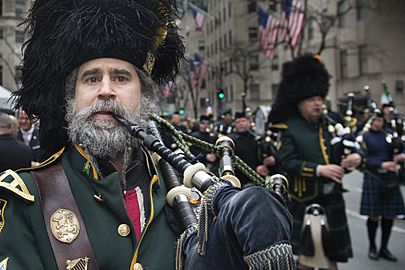
St. Patrick's Day parade
-
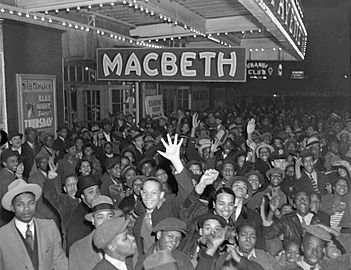
Lafayette Theatre in Harlem


| Year | Population | White (includes White Hispanics) |
% W |
Non-Hispanic Whites | % ANG |
Black | % B |
Asian | % A |
Other or Mixed |
% O/M |
Hispanic/ Latino |
% H/L |
Foreign born |
% FB |
|---|---|---|---|---|---|---|---|---|---|---|---|---|---|---|---|
| 1900 | 1,850,093 | 1,808,968 | 97.78 | N/A | N/A | 36,246 | 1.96 | 4,861 | 0.26 | 18 | 0 | N/A | N/A | 789,626 | 42.68 |
| 1910 | 2,331,542 | 2,266,578 | 97.21 | N/A | N/A | 60,534 | 2.60 | 4,260 | 0.18 | 170 | 0.01 | N/A | N/A | 1,116,477 | 47.89 |
| 1920 | 2,284,103 | 2,168,906 | 94.96 | N/A | N/A | 109,133 | 4.78 | 6,003 | 0.26 | 61 | 0 | N/A | N/A | 950,264 | 41.60 |
| 1930 | 1,867,312 | 1,633,329 | 87.47 | N/A | N/A | 224,670 | 12.03 | 9,124 | 0.49 | 189 | 0.01 | N/A | N/A | 689,506 | 36.93 |
| 1940 | 1,889,924 | 1,577,625 | 83.48 | N/A | N/A | 298,365 | 15.79 | 13,467 | 0.71 | 467 | 0.02 | N/A | N/A | 582,895 | 30.84 |
| 1950 | 1,960,101 | 1,556,599 | 79.41 | N/A | N/A | 384,482 | 19.62 | 16,083 | 0.82 | 2,937 | 0.15 | N/A | N/A | 461,102 | 23.52 |
| 1960 | 1,698,281 | 1,271,822 | 74.89 | N/A | N/A | 397,101 | 23.38 | 25,487 | 1.50 | 3,871 | 0.23 | N/A | N/A | 374,698 | 22.06 |
| 1970 | 1,539,233 | 1,089,302 | 70.77 | N/A | N/A | 380,442 | 24.72 | 47,332 | 3.08 | 22,157 | 1.44 | N/A | N/A | 307,630 | 19.99 |
| 1980 | 1,428,285 | 841,204 | 58.90 | 713,854 | 49.98 | 309,854 | 21.69 | 72,884 | 5.10 | 204,343 | 14.31 | 336,247 | 23.54 | 348,581 | 24.41 |
| 1990 | 1,487,536 | 867,227 | 58.30 | 726,755 | 48.86 | 326,967 | 21.98 | 110,629 | 7.44 | 182,713 | 12.28 | 386,630 | 25.99 | 383,866 | 25.81 |
| 2000 | 1,537,195 | 835,610 | 54.36 | 703,873 | 45.79 | 267,302 | 17.39 | 145,607 | 9.47 | 288,676 | 18.78 | 417,816 | 27.18 | 452,440 | 29.43 |
| 2010 | 1,585,873 | 911,073 | 57.45 | 761,493 | 48.02 | 246,687 | 15.55 | 180,425 | 11.38 | 247,688 | 15.62 | 403,577 | 25.45 | 470,305 | 29.66 |
Queens
Queens experienced huge population growth between 1900 and 2010. It became the most popular destination for Asian immigrants moving to New York City.
-
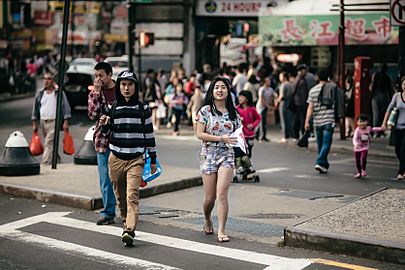
Main Street and Kissena Boulevard in Flushing
-
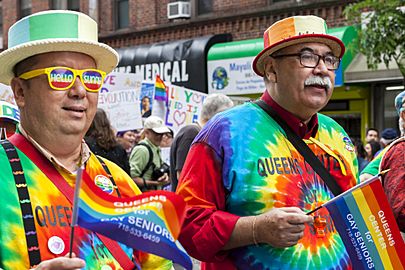
Queens Pride Parade in 2018
-
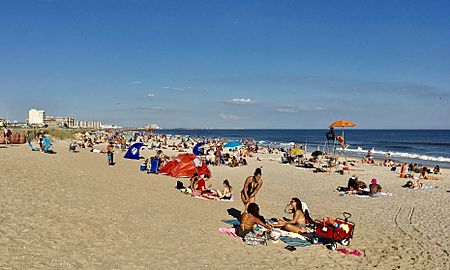
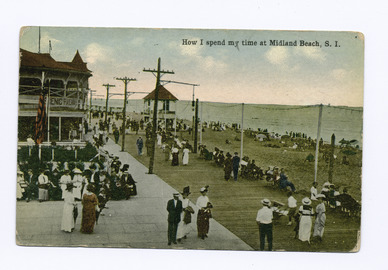
Sunbathers at Rockaway Beach


| Year | Population | White (includes White Hispanics) |
% W |
Non-Hispanic Whites | % ANG |
Black | % B |
Asian | % A |
Other or Mixed |
% O/M |
Hispanic/ Latino |
% H/L |
Foreign born |
% FB |
|---|---|---|---|---|---|---|---|---|---|---|---|---|---|---|---|
| 1900 | 152,999 | 150,235 | 98.19 | N/A | N/A | 2,611 | 1.71 | 152 | 0.10 | 1 | 0 | N/A | N/A | 44,812 | 29.29 |
| 1910 | 284,041 | 280,691 | 98.82 | N/A | N/A | 3,198 | 1.13 | 149 | 0.05 | 3 | 0 | N/A | N/A | 79,329 | 27.93 |
| 1920 | 469,042 | 463,661 | 98.85 | N/A | N/A | 5,120 | 1.09 | 214 | 0.05 | 47 | 0.01 | N/A | N/A | 112,171 | 23.91 |
| 1930 | 1,079,129 | 1,059,804 | 98.21 | N/A | N/A | 18,609 | 1.72 | 679 | 0.06 | 37 | 0 | N/A | N/A | 268,358 | 24.87 |
| 1940 | 1,297,634 | 1,270,731 | 97.93 | N/A | N/A | 25,890 | 2.00 | 947 | 0.07 | 66 | 0.01 | N/A | N/A | 278,937 | 21.50 |
| 1950 | 1,550,849 | 1,497,126 | 96.54 | N/A | N/A | 51,524 | 3.32 | 1,444 | 0.09 | 755 | 0.05 | N/A | N/A | 288,197 | 18.58 |
| 1960 | 1,809,578 | 1,654,959 | 91.46 | N/A | N/A | 145,855 | 8.06 | 7,084 | 0.39 | 1,680 | 0.09 | N/A | N/A | 335,623 | 18.55 |
| 1970 | 1,986,473 | 1,695,288 | 85.34 | N/A | N/A | 258,006 | 12.99 | 21,940 | 1.10 | 11,239 | 0.57 | N/A | N/A | 416,887 | 20.99 |
| 1980 | 1,891,325 | 1,335,805 | 70.63 | 1,172,511 | 61.99 | 354,129 | 18.72 | 93,780 | 4.96 | 107,611 | 5.69 | 262,422 | 13.88 | 540,818 | 28.59 |
| 1990 | 1,951,598 | 1,129,192 | 57.86 | 937,557 | 48.04 | 423,211 | 21.69 | 238,336 | 12.21 | 160,859 | 8.24 | 381,120 | 19.53 | 707,153 | 36.23 |
| 2000 | 2,229,379 | 982,725 | 44.08 | 732,895 | 32.87 | 446,189 | 20.01 | 392,831 | 17.62 | 407,634 | 18.28 | 556,605 | 24.97 | 1,028,339 | 46.13 |
| 2010 | 2,230,722 | 1,060,000 | 45.72 | 616,727 | 27.65 | 426,683 | 19.13 | 513,317 | 23.01 | 404,669 | 18.14 | 613,750 | 27.51 | 1,059,593 | 47.50 |
Staten Island
Staten Island was the slowest borough to change its racial makeup. It was the only borough to keep a non-Hispanic white majority after the 1980s.
-
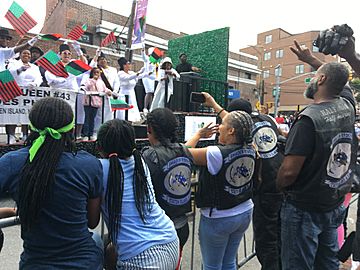
Staten Island Black Heritage Festival
-
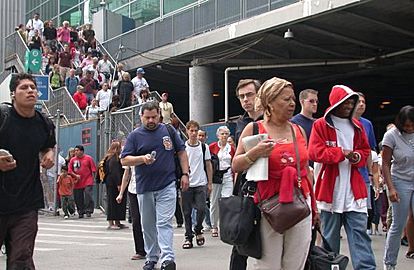
Commuters on the Staten Island Ferry

.JPG)
| Year | Population | White (includes White Hispanics) |
% W |
Non-Hispanic Whites | % ANG |
Black | % B |
Asian | % A |
Other or Mixed |
% O/M |
Hispanic/ Latino |
% H/L |
Foreign born |
% FB |
|---|---|---|---|---|---|---|---|---|---|---|---|---|---|---|---|
| 1900 | 67,021 | 65,863 | 98.27 | N/A | N/A | 1,072 | 1.60 | 86 | 0.13 | 0 | 0 | N/A | N/A | 18,687 | 27.88 |
| 1910 | 85,969 | 84,756 | 98.59 | N/A | N/A | 1,152 | 1.34 | 61 | 0.07 | 0 | 0 | N/A | N/A | 24,394 | 28.38 |
| 1920 | 116,531 | 114,953 | 98.65 | N/A | N/A | 1,499 | 1.29 | 78 | 0.07 | 1 | 0 | N/A | N/A | 31,795 | 27.28 |
| 1930 | 158,346 | 155,606 | 98.27 | N/A | N/A | 2,576 | 1.63 | 154 | 0.10 | 10 | 0.01 | N/A | N/A | 39,799 | 25.13 |
| 1940 | 174,441 | 170,875 | 97.96 | N/A | N/A | 3,397 | 1.95 | 163 | 0.09 | 6 | 0 | N/A | N/A | 35,318 | 20.25 |
| 1950 | 191,555 | 185,936 | 97.07 | N/A | N/A | 5,372 | 2.80 | 153 | 0.08 | 94 | 0.05 | N/A | N/A | 30,487 | 15.92 |
| 1960 | 221,991 | 211,738 | 95.38 | N/A | N/A | 9,674 | 4.36 | 448 | 0.20 | 131 | 0.06 | N/A | N/A | 25,428 | 11.45 |
| 1970 | 295,443 | 277,604 | 93.96 | N/A | N/A | 15,792 | 5.35 | 1,297 | 0.44 | 750 | 0.25 | N/A | N/A | 26,695 | 9.04 |
| 1980 | 352,121 | 313,534 | 89.04 | 300,511 | 85.34 | 25,616 | 7.27 | 6,709 | 1.91 | 6,262 | 1.78 | 18,884 | 5.36 | 34,514 | 9.80 |
| 1990 | 378,977 | 322,043 | 84.98 | 303,081 | 79.97 | 30,630 | 8.08 | 16,941 | 4.47 | 9,363 | 2.47 | 30,239 | 7.98 | 44,550 | 11.76 |
| 2000 | 443,728 | 344,319 | 77.60 | 316,316 | 71.29 | 42,914 | 9.67 | 25,253 | 5.69 | 31,242 | 7.04 | 53,550 | 12.07 | 72,657 | 16.37 |
| 2010 | 468,730 | 341,677 | 72.89 | 300,169 | 64.04 | 49,857 | 10.64 | 35,377 | 7.55 | 41,819 | 8.92 | 81,051 | 17.29 | 110,142 | 23.50 |
Images for kids
-
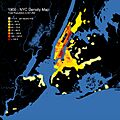
Map showing New York City's population density around 1900.
-
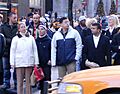
People waiting to cross Fifth Avenue
-
Various places in New York City.


