
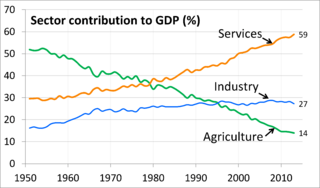
Image: 1951 to 2013 Trend Chart of Sector Share of Total GDP for each year, India

Description: The chart shows how India's economy has evolved over 62 years, that is from 1951 to 2013 while its economy and population has grown. The % contribution of agriculture, industry and services to its GDP for every year is shown in this chart in constant 2004-2005 prices (inflation adjusted). Agriculture made the largest contribution to India's economy in 1951 (52%), while services sector made the largest %GDP contribution in 2013 (59%). Data Source: Table 3 in GDP at Factor Cost at 2004-05 Prices, Share to Total GDP Databook, Planning Commission, Government of India (July 3 2014), pages 3-4. Note: India classifies software, IT, communications and such economic activity in its Services sector.
Title: 1951 to 2013 Trend Chart of Sector Share of Total GDP for each year, India
Credit: Own work
Author: M Tracy Hunter
Usage Terms: Creative Commons Attribution-Share Alike 4.0
License: CC BY-SA 4.0
License Link: http://creativecommons.org/licenses/by-sa/4.0
Attribution Required?: Yes
Image usage
The following page links to this image:
